Before you make any investment, whether it’s stocks, cryptocurrencies, or commodities, you are bound to look at the price chart. Now for some people checking the price chart might literally mean a quick look at the chart for any abnormalities. For others, checking the price chart might mean conducting technical analysis by drawing support and resistance lines to find the optimal entry-level.
This second investor needs some kind of tool to do analysis, and as made clear in the headline we’re going to use TradingView. TradingView is a platform with price charts for just about anything. The prices are updated in real-time by the second, which gives you the most accurate information out there. TradingView is also equipped with a ton of different tools to do the most thorough technical analysis. Therefore, I suggest you now open up any chart from TradingView and try the different features introduced to you in this article.
How to set up TradingView
To get started you need to create an account. When you create an account, TradingView will automatically save your default chart template, which is very helpful. TradingView also offers paid plans but we will dive deeper into those later.
After creating an account, and opening up the price chart of an asset you watch the most, you can then start customizing the settings. First I suggest you choose how you would like the price to be shown, candles, bars, line, or something else. You can do this from the top left corner next to the time frame, and also while you’re there you can adjust the default time frame you'd like to use. The times range from as short as 1 second to as long as 1 month. After that, you can start to further customize how you’d like your chart to look.
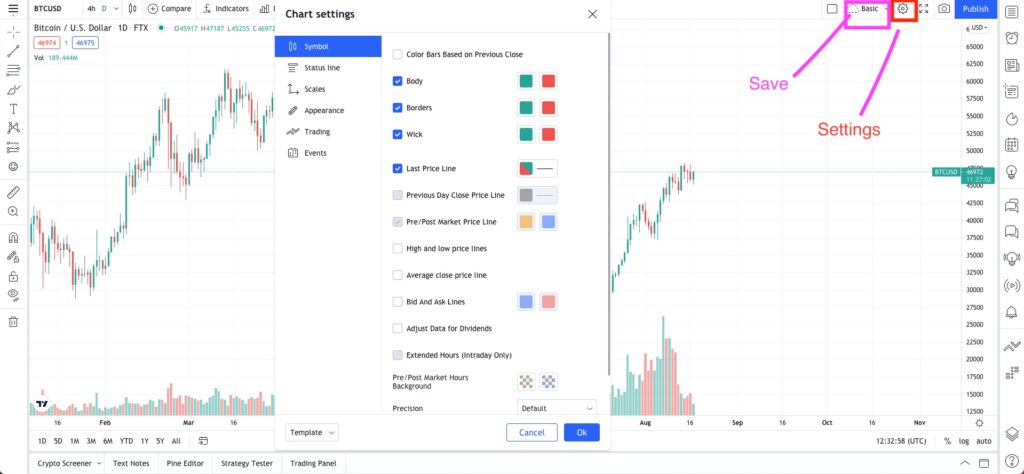 Find out what everything does by playing around. Image via TradingView.
 To access the basic layout settings you can either right-click the screen to access them, or you can directly access them by clicking the settings icon (looks like a gear) from the top right corner. Here you can find loads of stuff, some of which are purely aesthetic, while others can be truly useful in performing analysis.
Because there are a ton of different options available, and you might not know what they all do, I suggest you start playing around. Press whatever you like and see which lines and colors pop up from each option, try to find a good look and set-up for you. And if you don’t like a change going back is as easy as clicking the Undo button at the top of the chart.
Keep in mind though that some options won’t do anything for crypto charts, for example, the adjustment for dividends won’t be relevant for cryptos since they don’t issue any dividends. After you’re done playing around we’ll move on to the different tools and features you can use for analysing a crypto.
Different Tools for Analysing
Now that you’ve set up your different colored candles with a contrasting background (I like pink and blue candles on a yellow background) we can finally move on. As already mentioned, TradingView is highly useful for those who want to do technical analysis. When using TradingView there are essentially two ways of doing TA. You can either draw your own lines and indicators, or you can use the pre-built tools like Bollinger Bands and moving averages and form your TA analysis based on them. Now in this section will go through what you can find from the left side of your screen.
Here you can find everything from a simple line all the way to something called a polyline. From the second icon from the top, which is a line, you’ll find all the basic drawing functions you’ll need. This is also what you’ll most likely use the most since in every level of TA it’s common to draw trend lines for both highs and lows. By drawing these you can also find bigger patterns which you then can analyse more thoroughly with other tools.
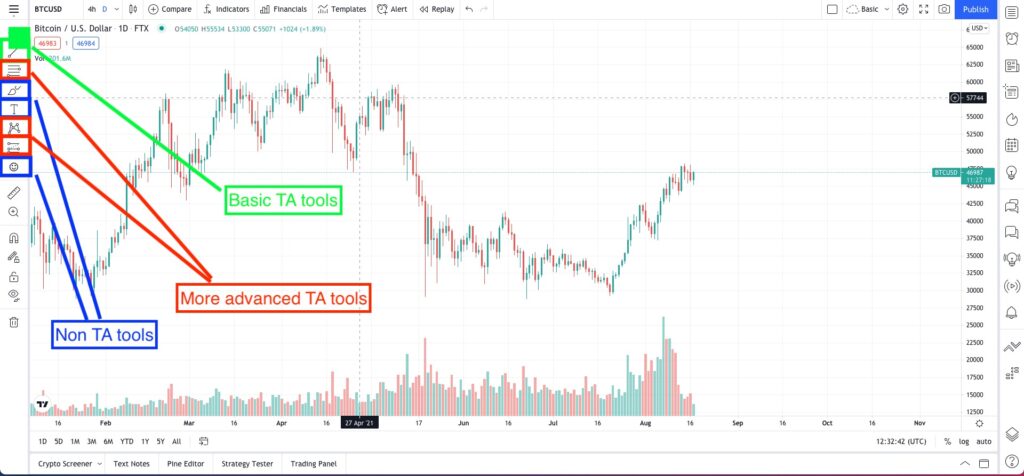 These tools will be the ones you use the most, so make sure to know how to use them. Image via TradingView.
 Ffrom the next icon, below the line, things will get more complicated. If you’re new to TA you won’t understand a thing and these tools will be completely useless to you. Therefore for everyone starting out with TA, I suggest you head over to Coin Bureau's Youtube channel where our lovely Guy has spoiled us by making a three-part introduction to technical analysis.
Essentially though, these are all indicators you can use to discover patterns from various price points. Again I suggest, even for those who know TA, that you play around with these and see what they do. Some might even be familiar and you just didn’t know the name of it. And to those who still don’t have a clue what any of them do, no worries. You don’t have to know how to use every single thing on TradingView to conduct valuable TA. Sometimes the most basic analysis works the best.
 It's just trading, not rocket science, although we do want to find those coins that'll go to the moon.
 Below the many confusing patterns, you’ll find additional symbols for even more confusing patterns but also for simple drawing tools. One thing from here worth mentioning is the risk/reward tool. You can find this from the smiley face symbol. You can look at the risk-reward for both long positions and short positions. Just position the middle of the tool on the price you’re about to enter and then adjust the top and bottom to match where you’re going to place your stop loss and take profit levels. This gives you a good overview of the trade you’re about to execute and whether your entry price needs adjustment for the risk/reward to be justifiable. Under these two tools you’ll also find other useful things, so play around. Next up we’ll talk about the indicators you can automatically set up on your chart.
Indicators
If you look at the top of your screen you’ll see the text "indicators" with a symbol next to it. This is where you’ll find every indicator you could ever imagine. There are both indicators built-in by TradingView along with a public library. The public library is excellent for those who follow someone via youtube or other places , who likes to make their own indicators.
Again, as with anything in TradingView, there are a lot of options to choose from. Their own built-in ones are the most commonly used and you will find some familiar and useful ones there. The public library on the other hand is endless. As you can see there are the number of likes next to the name of each indicator which gives you a good overview of whether it’s something useful or not. You can also search for a certain one if you know what you’re looking for.
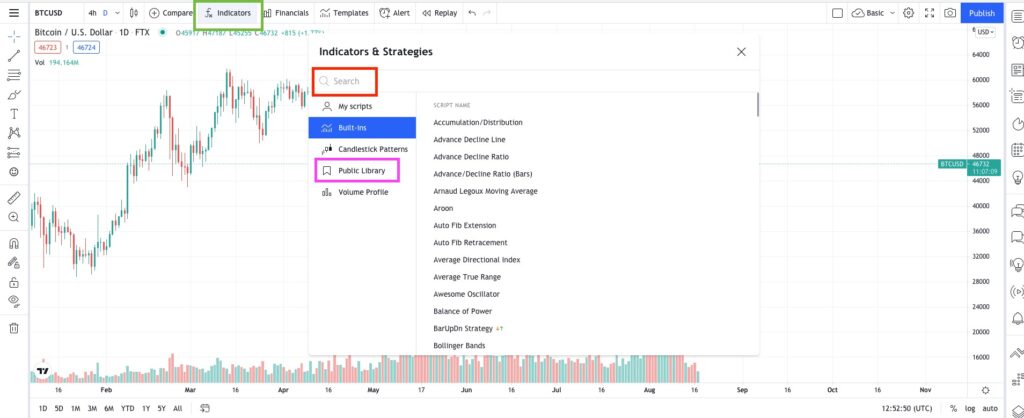 Learn how to use these, they are powerful tools. Image via TradingView.
 The last you can do here is to create your own custom indicators. This will need some coding skills and can be quite hard to do if you’re not experienced. However, those who do trading seriously might find some indicators which can be modified to work even better, and therefore you might be interested in the opportunity to use this feature.
Other Features
As already mentioned, TradingView is so much more than just a price chart platform. From the right side of your screen, you’ll find all the features that aren’t related to the charts. This offers the opportunity to conduct a much more thorough analysis.
Watchlist and Alerts
First, from the top you can find your watchlist. There’s not much to say about this. Simply pick the cryptos you like and add them to the watchlist. One thing which is good to remember is that when you type in Bitcoin, for example, it offers numerous trading pairs for it, therefore make sure to pick the one you want to use, and also the right exchange. If you pick the wrong trading pair or the wrong exchange, it can vastly impact your analysis and trades.
 You don't have to look at the chart all day, simply set up an alert and grab a coffee. Image via TradingView.
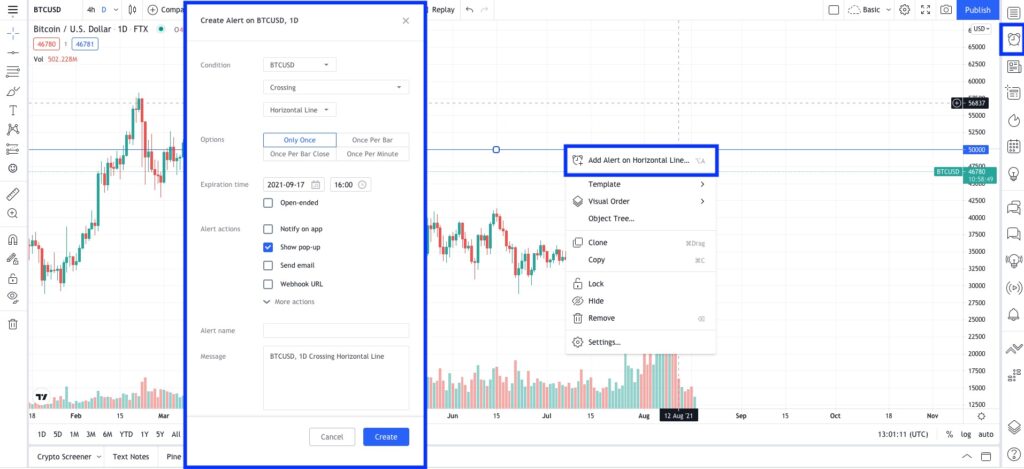
 The second symbol from the top shows your alerts. These alerts are price alerts that you can put for certain price levels. For example, you might have noticed that Bitcoin faces resistance at $50,000 and you might be interested in entering a long trade if Bitcoin breaks above that level. There are a few ways to set up these price alerts. First, you can either use the button on the right or there’s also one at the top of your screen. These will open up a menu where you can set up which price you want to be notified about and how you want to be notified.
The other way is to use your pre-drawn lines. For example, if you’ve drawn an upwards moving trend line from previous lows you might be interested in entering when the price again hits that line. To do this you can right-click on that line and choose “add alert on trendline”. This is extremely useful for both doing trading and for beginners to test their hypothesis.
News and Calendar
Next up on the list, we have an icon that looks like a newspaper, and that’s exactly what it is. Here you can find news about the asset you’re analysing. This is particularly useful for those who like to do more than just TA before entering a position. For trend traders, it opens up the opportunity to see whether the sentiment in the most recent news is in line with the price action. However, keep in mind that this works best for larger cryptos and the news coverage for smaller coins and tokens might not be up to date. Thus, what you see in the section might be news on the crypto market in general rather than the specific crypto you’re analysing.
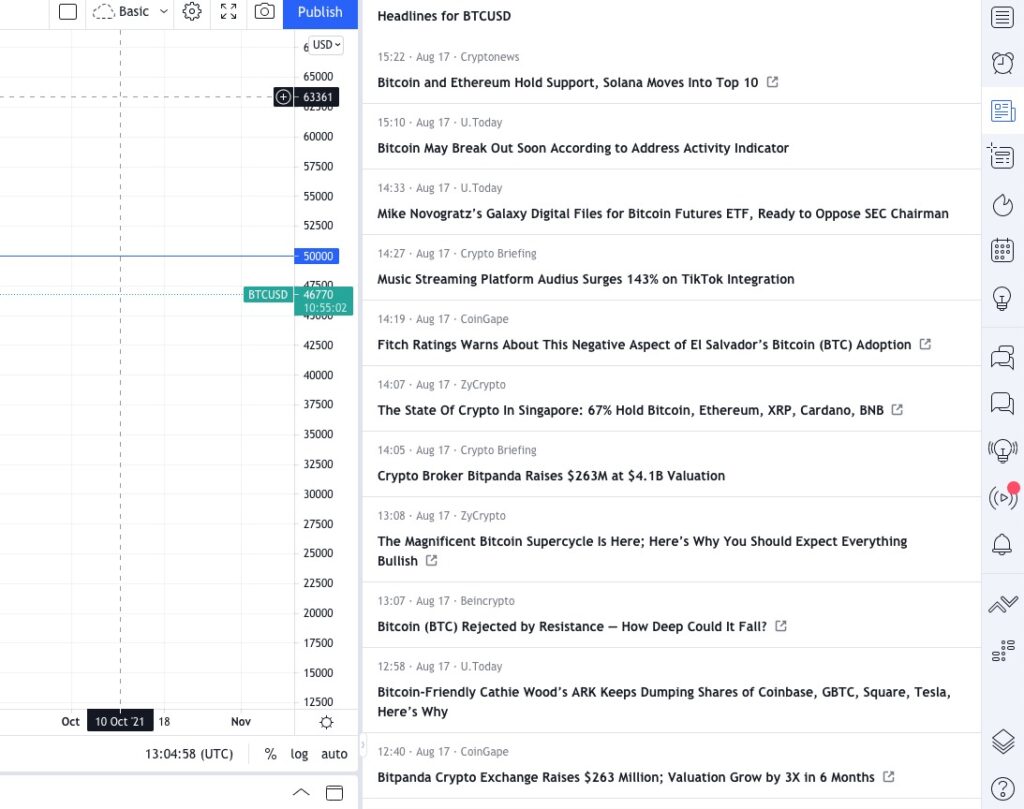 TradingView offers news from various sources. Image via TradingView.
 The next two things do not offer much for crypto traders since the first one is just a data window with a few simple things like highs, lows, and volume. Yes, these are important numbers but they can also be found from the chart. The thing below that is the hotlist. This would be useful if it were to feature cryptocurrencies. Currently, you can only choose different countries' stock exchanges. However, for those who like to trade crypto-related equities, this is something you can look at to see if the company you’re researching is there.
Below the hotlist, you can find a calendar. This gives you excellent information about both macroeconomic indicators that are being published along with certain statistical data about the asset you’re researching. You can filter from the top so that it only shows the most important events. These are usually the big macroeconomic indicators and they are good to keep an eye on since they give useful indications on how theworld's economies are doing and where the broader financial markets might be heading.
Public Interactions
From the lightbulb symbol down to the two arrows, you’ll find different social tools. Here you can enter public chat groups and search for ideas from others and also share your own ideas. Just remember not to listen to all the expert traders that are trying to convince you to pump a certain coin. Do your own research and invest according to that. Additionally to the public chats, you can also create private chats if you have a friend who is also interested in analysing and trading cryptocurrency.
 Be aware of scammers that are trying to rip you off.
 Another fun tool is the streaming tool, which is still in its BETA mode. Here you can watch other people do trades and analyse certain assets. This might be something you can use to find those next tradable assets, but as with chats, be aware of scammers. The more someone is talking about something pumping the less you should listen to them. If someone on the other hand provides you good analysis by drawing the patterns and explaining how they work then there’s no harm in listening to that.
Crypto Screener
Before you get to analysing a cryptocurrency you need to know which one to pick. For this, TradingView offers the perfect opportunity. From the bottom left of your screen, you’ll find a button that says “Stock Screener”. You can change that to a crypto screener which then gives you all the cryptocurrencies TradingView offers. With this tool, you can then filter all the options with numerous different metrics.
From the crypto screener, you’ll find a useful metric to watch, which is the TradingView rating. This consists of several indicators that show whether an asset has strong momentum or not. This could prove to be particularly useful for trend traders, so be sure to have a look at it. Then when you find a few cryptocurrencies which you like you can start analysing them by comparing their charts. Another useful comparison could be with Bitcoin to see in which phases of the Bitcoin cyclethat particular crypto tends to soar. This feature can be found in the top left of your screen.
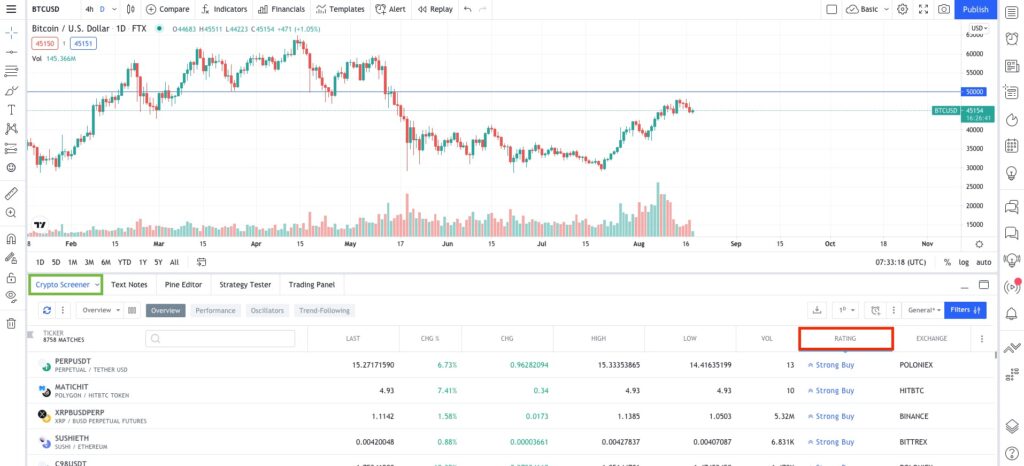 This too is a powerful tool to find those big money trades. Image via TradingView.
 To test whether the TradingView rating or your analysis is any good you can use TradingView paper trading. This means that you trade with fake money but with real prices. This is perfect for those who want to practice and maybe try some new TA.
In comparison to many other paper trading tools, TradingView offers the most up to date prices and it also offers the opportunity to, for example, use stop losses. It’s also handy to practice on the same platform where you’re doing the TA. Then when you’re done playing around with fake money you can just connect your broker to TradingView and trade directly from there. TradingView supports brokers like Gemini.
Paid Plans
As mentioned earlier in this article, TradingView offers paid plans. They offer three different ones with the cheapest being $14.95 per month. For beginners, I would suggest you start with the free plan. The benefits you get from paying are simply that you have more storage and a few additional tools.
The paid plans allow you to view more charts at the same time, save more templates, and use more indicators at the same time. Therefore when you’re just starting you want to keep things simple and might not need 25 indicators displayed on your screen at the same time.
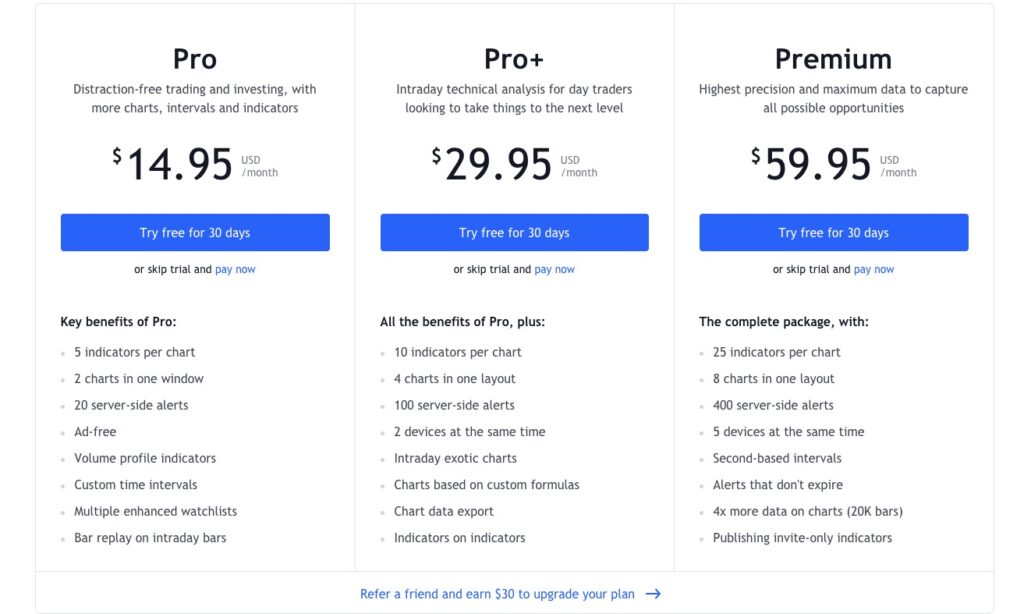 See which one suites you the best. Image via TradingView.
 Then naturally when you move on to more advanced TA and maybe need some of the paid custom tools along with more storage to save all your TA’s for different charts, you might want to upgrade your plan. However, before paying anything they now offer a 30-days free trial, so make sure to use that if you’re considering an upgrade.
Conclusion
Hopefully, you now have a better understanding of how TradingView works and how you can use it to potentially find the next big trade. Just remember that the platform itself does not make you a pro-trader, but rather your knowledge does. To even dream about using all the fancy features TradingView has to offer you need to be very familiar with TA. TradingView won’t give you any 100x gains if you don’t know how to do research, not even if you were to pay for the most expensive plan. Therefore make sure to educate yourself on TA and with that, you will learn how to use the platform and get the most benefit out of it.
Furthermore, although we covered a very broad set of different features there’s still so much more left to discover in TradingView. Therefore I suggest you head on to Youtube where there are videos about small tips and tricks along with videos that show you how to use different features and indicators. And also, as multiple times encouraged, play around. The best way for you to truly see what something does is to just try it. You can always go back to the way it was with command+z. Have fun!