Bitcoin Below $60K for the First Time in 10 Days – Should You Buy the Dip?
Bitcoin is below $60,000 for the first time in over 10 days after what many crypto investors saw as an anticlimactic break of all-time highs. After spending 6 months below its previous all-time high just short of $65,000, Bitcoin made it all the way back and managed to break $66,000 before losing steam. At the time of writing, BTC is trading just above $59,000.
Aside from a few select altcoins, almost the entire crypto market followed Bitcoin's lead today by making a downward move. As is often the case, excess leverage may have played a part in the correction. According to Bybt, a total of 182,855 traders were liquidated across 8 diferent exchanges, costing retail crypto speculators over $900 million. According to the data, Binance had the most liquidations, and Ethereum cost traders the most amount of money with over $300 million in losses. Aside from Etheruem, the majority of liquidations were spread across Bitcoin, Polkadot, XRP, Dogecoin, Solana, Cardano, and notably, Shiba Inu (SHIB).
 Image via Shutterstock
Everytime Bitcoin corrects, the high-flying price targets up in the six figures always recieve skepticism. PlanB, who predicts a minimum of $63,000 BTC for this month's closing price and $98,000 for next month, is unfazed by the market downturn.
https://twitter.com/100trillionUSD/status/1453294080457334791
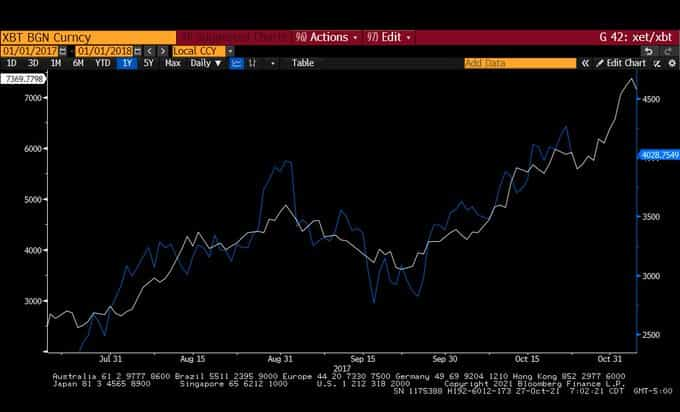
And looking at Etheruem, macro investor and Real Vision Group CEO Raoul Pal sees the latest downturn as just another stepping stone to an eventual price rise. Pal has always asserted that Ethereum is likely following Bitcoin's price trajectory from between 2013 to 2017. Based on this thesis, ETH could still correct significantly and the idea would remain intact.
"The ETH 2021 vs BTC 2017 parallel continues its weird wizardry..."
 Raoul Pal/Twitter
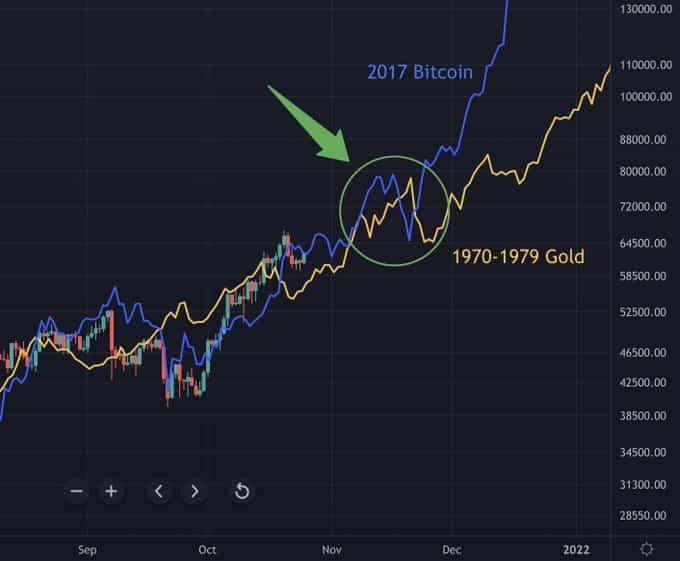
Popular crypto analyst TechDev has been testing another circulating theory that posits Bitcoin following what gold did in the 1970s, not just now but also in 2017. He overlays Bitcoin's 2017 market cycle with that of gold in the 1970s, plus adds BTC's current run. While heavy on the speculation, the similarities are still interesting. The analyst says this correction, which currently puts Bitcoin about 12.3% away from its all-time high, is nothing to worry about for bulls.
"I can almost promise you…
If you’re freaking out over this minor ABC correction…
You’re probably exiting the market in November."
 TechDev/Twitter
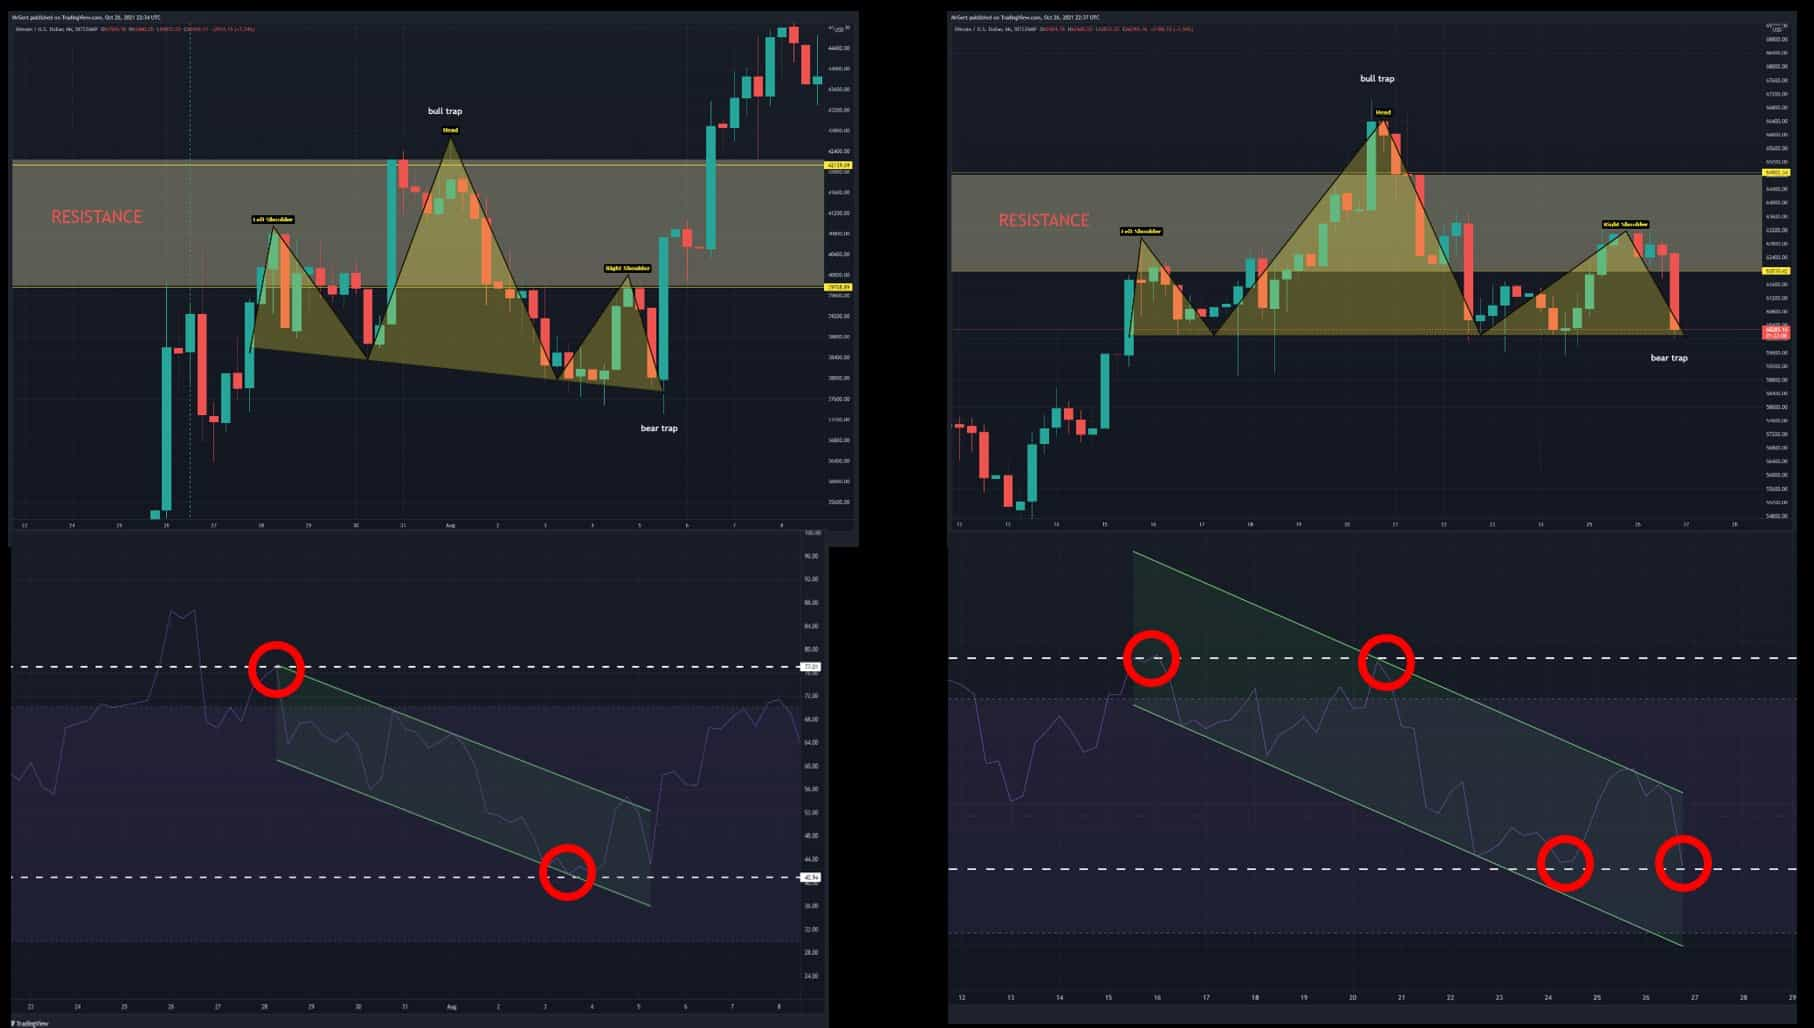
Crypto analyst Gert van Lagen has speculated that Bitcoin is forming a similar pattern now that it did at the $40,000 level. His comparison shows BTC making a classic head and shoulders pattern while the relative strength index (RSI) forms a downward channel. Back then, right when the head and shoulders pattern completed, BTC shot up to eventually make new highs.
"$BTC [6h]: compare the RSI channels at the $40k-$42k bear trap and the current situation at the $62k-$65k Wyckoff support.
This head and shoulders could still be very well a bear trap."
 Gert van Lagen/Twitter
Disclaimer: These are the writer’s opinions and should not be considered investment advice. Readers should do their own research.