Since 2008 when the Bitcoin white paper was released, a key question for all who have considered investing in it has been how to value Bitcoin. When valuing stocks, we analyse a company's fundamentals with different metrics and formulas like P/E ( price to earnings), P/S ( price to sales), discounted cash flow analysis, and many more. But when it comes to Bitcoin, we don't have any earnings or cash flow, so how should we value it?
Because people quickly realised that bitcoin can't be valued similarly to companies, they started to look for other assets to compare with Bitcoin, and many settled on gold. The key similarity between Bitcoin and gold is that both assets are scarce. Scarcity is the main feature of these assets and why we value gold as highly as we do. After all, it's not like gold is particularly useful or plays an essential part in our survival.
 Is BTC like gold, or even better?
 So now that we have assets to compare with Bitcoin, we just need to figure out how to value scarcity correctly. But first, let's answer the question many of you are probably thinking about, what or who is Plan B.
Who is Plan B?
Plan B is an anonymous person we don't have much information about, so we haven't figured out his true identity. However, we do know that Plan B is a Dutch institutional investor who got into bitcoin in 2013. Plan B is said to have two degrees, one in finance on quantitative analysis and one in banking and financial law. He has always worked in finance, and also now he has a day job, with crypto being more like a serious hobby for him.
When he first got into crypto in 2013, he started to look for a way to value these digital assets. When he couldn't find any reliable method, he started creating one himself. Plan B got his inspiration from Saifedean Ammous. For those who don't know who he is, he created one of the most famous Bitcoin books called The Bitcoin Standard. In this book, Ammous explains the stock-to-flow model and how it creates value for gold and other scarce assets.
Then in 2019, Plan B finally published his stock-to-flow model on bitcoin, which has gained huge popularity due to its quite accurate indications. Although lately, people have started to question its accuracy since it is now the furthest away that it has ever been from the price target. After the stock-to-flow model on Bitcoin was released, he continued to develop his model. A year later, he released another model called the stock-to-flow cross-asset model, which considers other scarce assets like gold and silver.
 We do not know his true identity but he uses this hat as his symbol. Image via Plan B’s Twitter
 Stock-to-flow on Bitcoin
For all commodities or basically all items with a quantifiable amount and a quantifiable production, you can count their stock-to-flow. It is simply to divide the item's stock with its flow. This gives a value that states how many years it would take to produce the amount you have in inventory; for example, gold has an SF of 62, as you can see from the chart. This is what Saifeadean Ammous explained in his book.
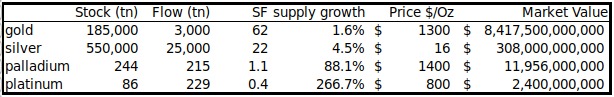 The stock-to-flow of a few commodities. Image via PlanBTC.com
 For commodities used in everyday life like copper, aluminium, palladium, or platinum, it is almost impossible to escape the trap of a low SF because if its demand increases, so will its flow. This is why scarcity has value since, especially in bitcoin, it is impossible to increase the flow, which means that if there is demand, it will not drive the flow up, but rather the price. This is, in fact, why from a scarcity viewpoint, bitcoin is the optimal asset, even better than gold since gold’s flow could also technically rise significantly if someone finds large amounts of it.
When Plan B applied the stock-to-flow model for Bitcoin, he used 111 data points from 2009 to 2019. Then he used a linear regression which clearly showed a correlation between bitcoin’s market cap and its SF. He used different colours for his charts, where blue represents the months close to a halving and red the price a few months after that.
He did this because a halving plays a huge role in this model. After all, the stock to flow doubles when the flow gets cut in half. This is why according to Plan B, the price usually jumps a few months after halving since bitcoin gets more scarce. To further support his model, he also used the same thing for gold and silver (marked with a yellow and grey ball) and saw that they are also correlated with the model.
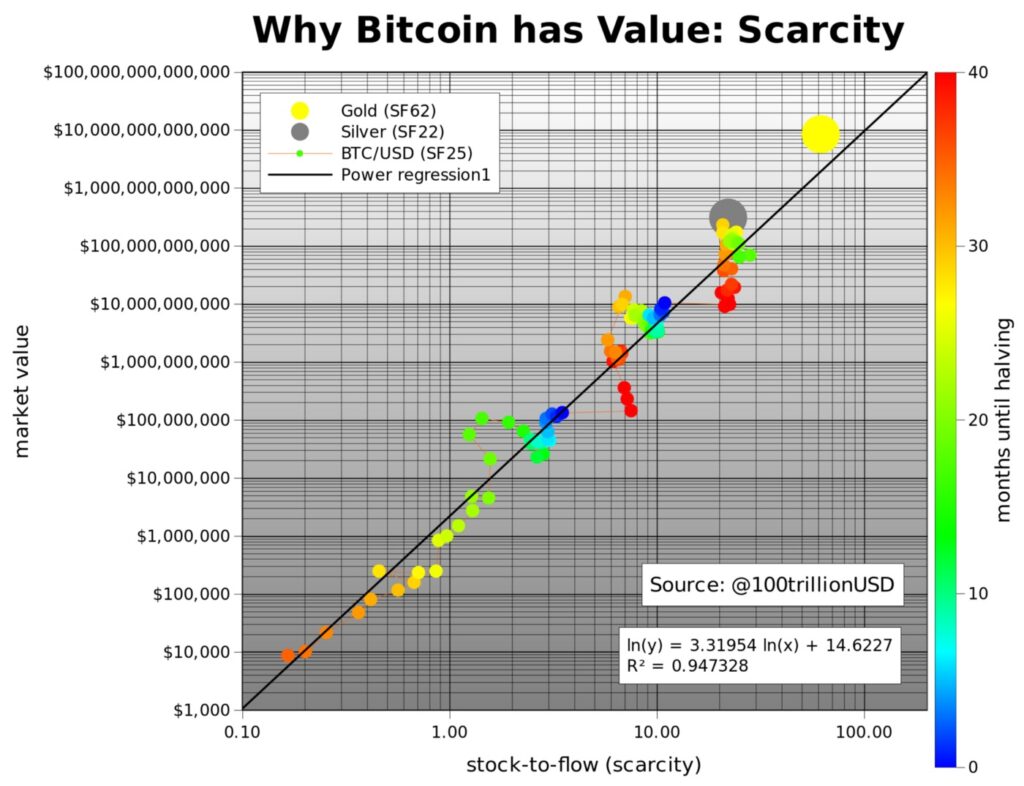 Chart made by Plan B. Image via PlanBTC.com
 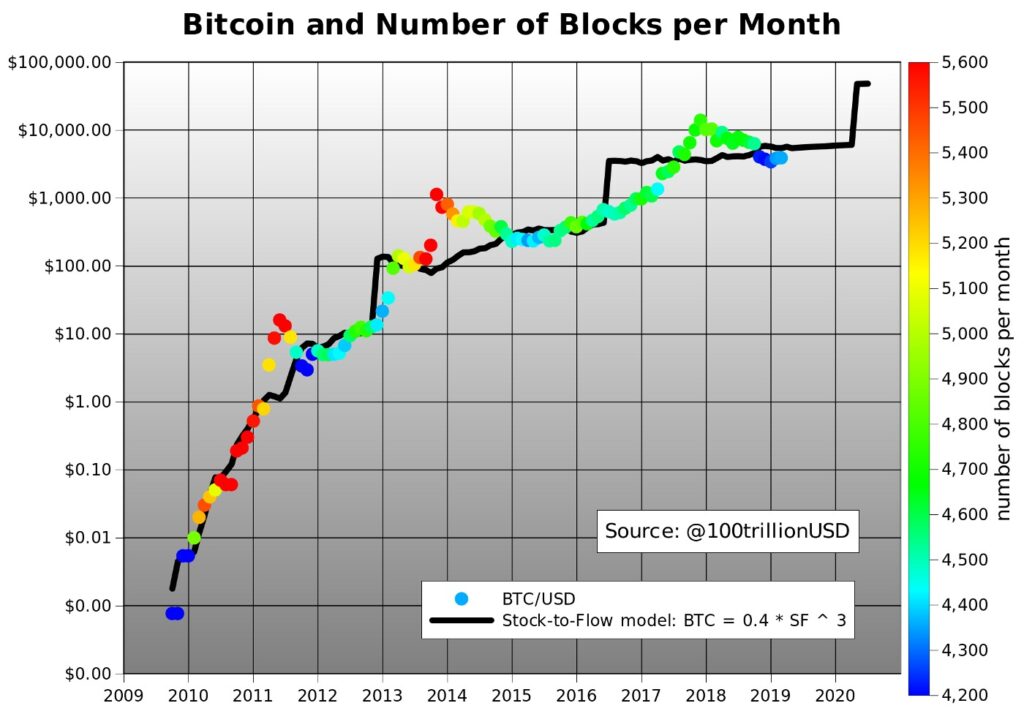 Chart made by Plan B. Image via PlanBTC.com
 Many of you are probably now wondering if the model really works, and as a simple answer to that, it looks like it does. When Plan B tested his model, it gave him an R2 of 95%; why not 100%, you may ask. Well, that is never possible because there are so many things that influence the price of bitcoin, like regulations, hacks, and many other things.
That is why the price will never be on a straight line. Plan B also says that you can't be entirely sure that there is a real correlation, but it is highly likely. Another fact that supports his model is that it showed a market cap prediction of $1 trillion for bitcoin after the latest halving, and that is roughly the level reached by Bitcoin. Of course, as already mentioned, we are now the furthest we've been from the price prediction, but we'll later talk more about whether to use this model or not.
Stock-to-Flow Cross-Asset Model
The main difference between this new model and the old one is that the old one was a time series model for bitcoin, and this new one is a model that you can use to value all similar assets. Basically, time has been swapped with other assets in this new formula. Plan B also mentions that to use this new model, you need to understand phase transitions which play an essential part in using this model.
To explain phase transitions, Plan B uses three examples, water, dollar, and bitcoin. As probably all of us know, water can be solid, liquid, gas, and ionised; it is still water but just in different phases.
 Typically we only talk about three of these, solid-liquid-gas. Image via PlanBTC.com
 Plan B explains that phase transitions also appear in finance, for example, in the dollar. First, it was a gold coin, then a paper backed by gold, and then just paper backed by nothing. In all these phases, it was called the dollar, although it was a completely different thing.
 Gold coin - paper backed by gold - paper backed by nothing. Image via PlanBTC.com
 Now to the bitcoin phases. First, we had “proof-of-concept” when Bitcoin was first released. Then we had the “payments” phase when one Bitcoin was equal to one dollar. Thirdly came the “e-gold” phase, which was after the first halving. And then now we are in the “financial asset” phase.
Okay, so how do these phases work then? In the chart down below, you can see monthly data from the original SF model and how they form these clusters. You can also see the gold and silver data points which seem to line up with the rest. Plan B explains that these clusters are being formed and correlated with the SF and market cap; according to him, this model has an R2 of 99.7%.
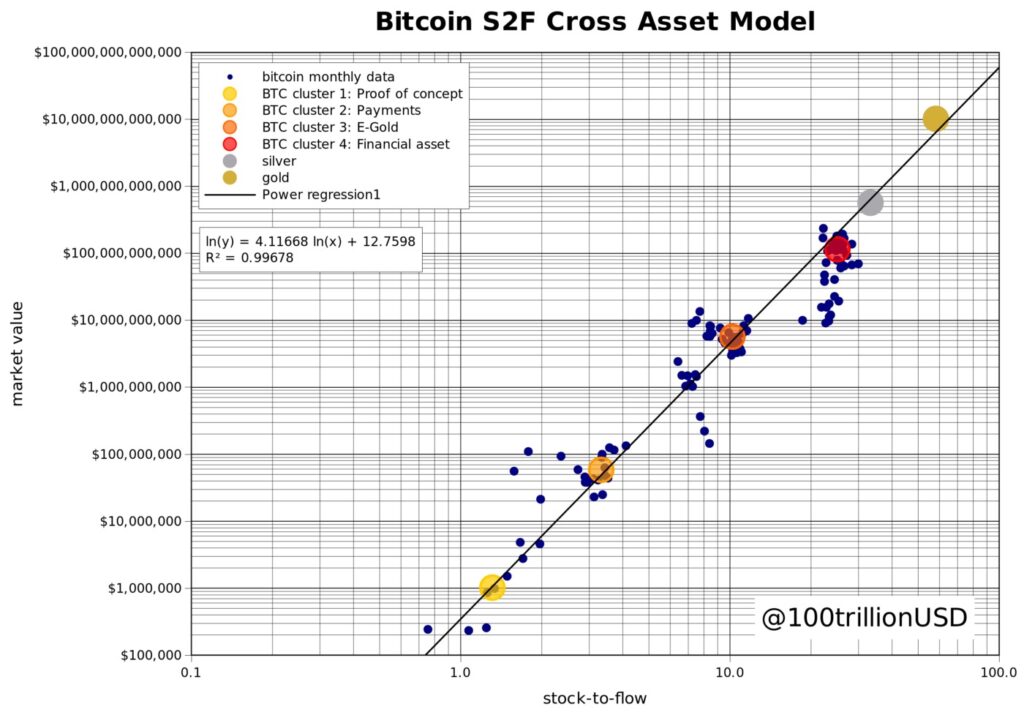 Chart made by Plan B. Image via PlanBTC.com
 Do the Models Work?
We already briefly looked at this for the SF model but let’s see if we can further look at how these models could possibly give us a hint of where we are going.
So with the original model, we currently should have a price of around $110k, and this is why many have started to wonder if the model actually works. For the stock-to-flow cross-asset model, we have a price target of $288k between 2020-2024. As you probably noticed, the target prices are quite far from each other and even further away from the current price; what should we do?
On Scott Melker’s Youtube channel, Plan B himself said that markets should not be predictable, and that is, of course, a fact to some extent since otherwise we would all be at least millionaires. However, we also know that bitcoin is a relatively young asset, and to find a formula that represents some sort of correlation might not be that difficult.
The correlation might just be a coincidence. This is, in fact, what Ethereum founder Vitalik Buterin said. Or, to be more accurate, he didn’t say that the SF model was wrong. He just said that you can’t know whether this model actually works, but neither can you say that it doesn’t work.
 Hmmm... Read till the end to find out.
 On top of those who have neither discarded nor acknowledge the model, there are also those vehemently against it. One of the perhaps “best” critiques against this model comes from Nico Cordeiro, the chief investment officer at Strix Leviathan LLC. In his article, he explains how SF is just a chameleon model.
The term chameleon is used for something that seems true when first looked at, but it turns out to be nonsense when digging in deeper. In my opinion, there are three crucial factors in the article which made me question the whole SF model. Firstly from the chart below, you can see 115 years of data points for gold, and I think everyone can see that they are not in a line.
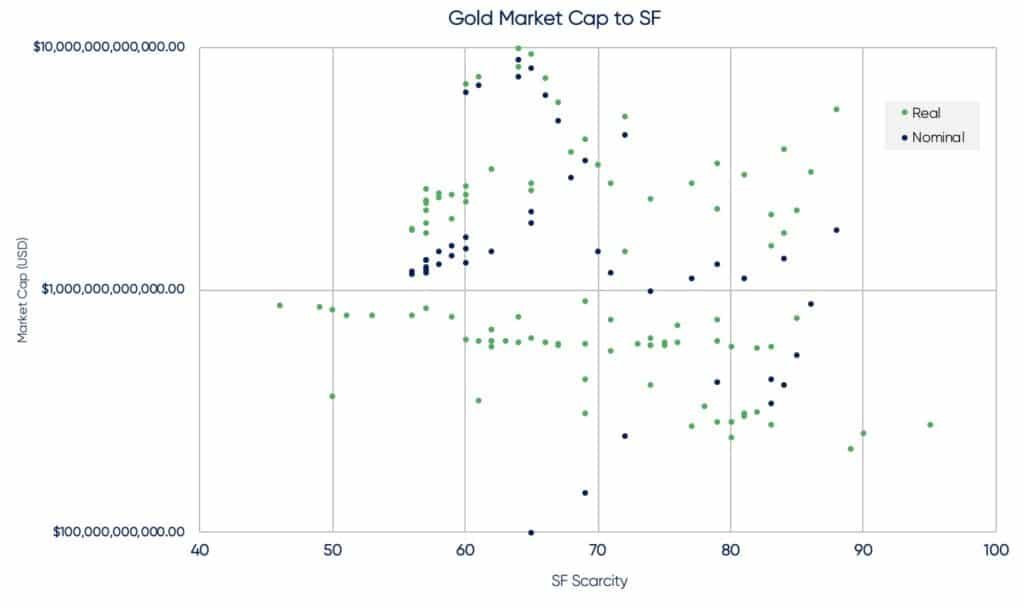 No straight line in this chart. Image via CoinDesk
 Secondly, as for all markets, you can't predict the price based on its historical performance. This is again a fact that has been researched numerous times and is also quite logical since if we could predict the price based on history, then all of us would be millionaires.
Then lastly, maybe even the most crushing statistic of them all. Based on the SF model, in 2045, the price of ONE bitcoin would be $235,000,000,000. Yes, the price of one bitcoin. I don't even think we have to talk about this number any further since even you, who are the most bullish about Bitcoin, might understand that this will probably not happen.
 With one bitcoin worth $235,000,000,000 even my 0,001 BTC would make me rich🤑
 So, is this it for the Models?
NO! As I listened to Scott Melker's Youtube video in which he had Plan B as a guest, I got a lot more confident in his hypothesis. Yes, as seen from the previous section in this article, the model might not be completely accurate and can have some flaws, but that's just how it is. Try to tell me one model that has ever predicted an asset's price accurately over the long run. That's right, you can't. That is because markets can't be predicted.
Okay, so why do I believe in the model? Well, as seen before, it has been able to predict the price whether it was a coincidence or not. I also think that the fundamental value of scarcity is there and that the SF model could be accurate in the growth phases of bitcoin, so at least until bitcoin reaches the value where it starts to stabilize. Because if you think about bitcoin, it is its scarcity that makes it attractive. That is why we want to use it as a hedge for inflation.
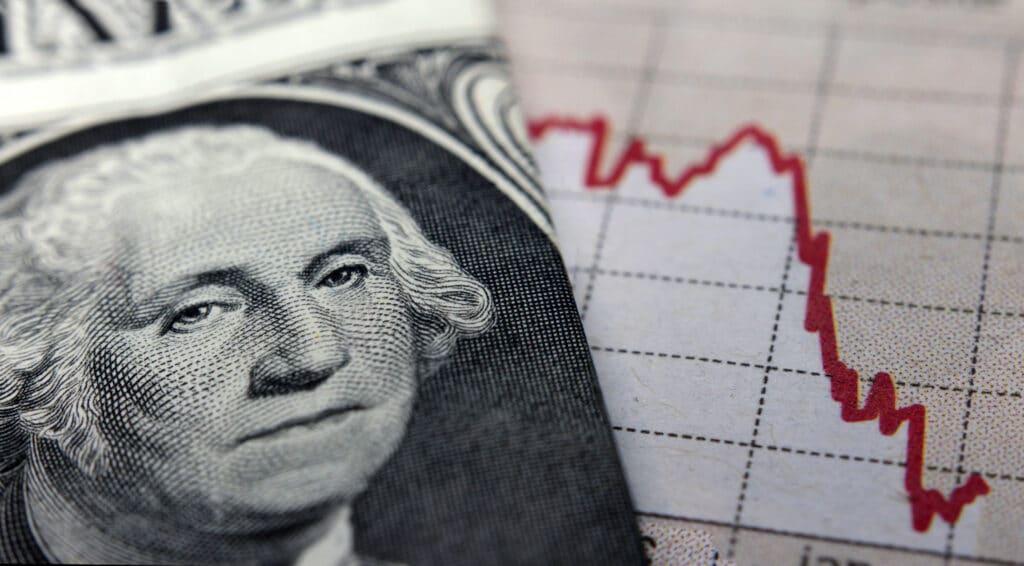 Inflation decreases the value of a dollar and in theory BTC could be a hedge for that.
 We can also see that the adoption of bitcoin has increased tremendously, and many hedge funds are thinking - or have already - about investing in bitcoin. This supports the fact that Bitcoin is in its growth phase. I believe it will continue to follow the SF price because of its flow.
When Bitcoin grows and many more start using it as an asset to HODL, the supply will be limited, but the demand will remain. This will force those who want bitcoin to purchase it from someone else since there is no other way. Yes, you could start mining, but then again, it has a high cost of entry, it takes a long time to become profitable, when more people mine, your chances of making money decrease, and it will take too long for, for example, hedge funds to gain a position they are comfortable with.
Then at some point, I think we will reach the price where Bitcoin starts acting more like gold now does. After that, we won't see huge swings, and I do not believe that halvings will play an as important part as they do now. When Bitcoins market cap reaches over a certain point - which I can't calculate - there won't be enough money to push it up although the SF value increases, and that will be the point when Bitcoin and SF part ways.
 High demand + low supply = TO THE MOON
 Hopefully, some of you understood what I was trying to explain, although I'm no financial expert and can't provide you with any approximate numbers. But the main point was that Bitcoins scarcity is its value and that a limited supply + increasing demand + impossible to increase flow = higher price.
Current Market Conditions
Before wrapping this up, I wanted to quickly go back to Scott Melkers Youtube video, which I already talked about, since there Plan B explained where he believed we are now and where we are going. The video came out on the 20th of May, and there he explained that according to his on-chain analysis, this cycle is not over yet. Unfortunately, he couldn't tell what he used to make this analysis, but he gave us some price predictions.
Plan B believes that with the current market sentiment, we could go as high as $400-500k and then see a drop back to $100-200k. He believes that if we start moving up, then FOMO will drive the price up until fear pushes it back down. He explained that the money would come from increasing adoption from institutions and also retail investors. Although Plan B believes in his bullish predictions, he also said a few important things to remember:
- Only invest in bitcoin what you are willing to lose, which makes sense because it is a risky asset.
- Don't take his models too seriously; he thinks you should take it more like an estimated average target and not an accurate price prediction.
- He believes that there will be one big battle between BTC and governments that can influence the market and further push it away from his model.
Conclusion
After reading this article, you might have very mixed feelings about these models and whether to believe them or not, and that is precisely how I felt, too, after doing all this research. There is clearly something accurate, and it would be highly unlikely that everything Plan B has said is nonsense and just based on coincidence. But on the other hand, we have those who have proved it wrong with some solid facts.
So in these mixed feelings, I would suggest to again, as always, keep your head cool and not make any moves just because of one model. It is great to see these bullish predictions, and it might be tempting to believe the most bullish scenario, but you have to think rationally and do your own research. Bitcoin is still a young asset, and we need to further study it and see how it evolves and how we evolve with it.
The best thing to do if you believe in bitcoin is HODL, and look at your portfolio in 10 years and see what has happened.