Crypto analysis tools help users read the market beyond token prices. They can track wallet activity, DeFi liquidity, technical charts, sentiment, derivatives data, protocol revenue, and portfolio exposure.
This guide breaks down the best crypto analysis tools for traders, investors, researchers, and DeFi users. We compare platforms for on-chain analytics, wallet tracking, technical charts, derivatives data, DeFi metrics, sentiment analysis, portfolio monitoring, and protocol fundamentals.
Editor's Note (May 1, 2026): We fully updated this article in May 2026. The refresh adds newer and more relevant tools that we actually use, including DeFiLlama, Messari, Dune, CoinGlass, CryptoQuant, and Coinalyze, while reorganizing the guide by real user needs such as on-chain analytics, DeFi data, derivatives tracking, sentiment analysis, technical charting, portfolio monitoring, and protocol fundamentals. We also tightened the methodology, added clearer tool-stack recommendations, expanded beginner-friendly guidance, and updated the final verdict so readers can build a practical research setup instead of relying on one dashboard for everything.
Best Crypto Analysis Tools At A Glance
The best crypto analysis tools include Glassnode and Nansen for on-chain analytics, DeFiLlama for DeFi protocol data, TradingView for technical analysis, Messari and Dune for crypto research, Santiment and LunarCrush for sentiment analysis, CoinGlass for derivatives data, and CoinGecko for market data. A good research stack usually combines a few of them instead of relying on one dashboard for everything.
Glassnode
Useful for Bitcoin, Ethereum, and broader institutional-style market metrics, especially when studying cycles, investor behavior, and network activity.
Nansen
Strong for wallet intelligence, labeled addresses, Smart Money flows, and tracking how active wallets move across tokens, chains, and DeFi protocols.
Arkham
Helpful for blockchain intelligence, entity tracking, wallet clustering, and following visible fund flows across major crypto networks.
DeFiLlama
One of the clearest tools for TVL, yields, bridge flows, protocol categories, stablecoins, fees, revenue, and broad DeFi market structure.
TradingView
A go-to charting platform for technical analysis, alerts, indicators, watchlists, multi-asset charts, and trader-focused market views.
Messari
Useful for reports, protocol profiles, research dashboards, token screeners, sector tracking, and structured crypto market intelligence.
Dune Analytics
Best for analysts who want SQL-based dashboards, custom queries, protocol-level charts, and community-built blockchain data views.
CoinGlass
Useful for Open Interest, Funding Rates, liquidations, long-short ratios, options data, and derivatives-heavy market context.
CryptoQuant
Strong for BTC exchange flows, miner data, whale movements, stablecoin reserves, and market signals tied to centralized exchange activity.
CoinGecko
A practical market data hub for prices, token pages, exchange data, DEX data, categories, NFT tracking, and quick market checks.
Santiment
Useful for whale behavior, development activity, sentiment indicators, on-chain signals, and behavioral trends across crypto markets.
LunarCrush
Designed for social trends, influencer activity, community momentum, social engagement, and sentiment signals around crypto assets.
Token Terminal
Helpful for protocol revenue, fees, user activity, financial metrics, and comparing crypto projects through a fundamentals-style lens.
DeBank
Useful for monitoring wallet balances, DeFi positions, protocol exposure, token holdings, and cross-chain portfolio activity.
Zapper
A clean option for cross-chain portfolio views, wallet activity feeds, DeFi positions, NFTs, and everyday wallet monitoring.
Glassnode, DeFiLlama, TradingView, Dune, CoinGecko
A balanced research setup usually needs on-chain data, DeFi metrics, charts, custom dashboards, and fast market tracking rather than one tool trying to do everything.
Disclosure
Some links in this article may be affiliate links. If you choose to use a service through these links, we may earn a commission at no additional cost to you.
This article is for education only and is not financial advice.
Methodology
We chose these crypto analysis tools based on how useful they are in real research, not just how many dashboards they offer. We looked at data quality, chain and asset coverage, ease of use, free-tier value, alerts, customization, and whether each tool helps users understand price, liquidity, wallets, DeFi activity, sentiment, or protocol fundamentals more clearly.
How We Chose The Best Crypto Analysis Tools
We chose these crypto research tools based on how useful they are in real research, not just how many dashboards they offer. A tool had to help readers answer clearer questions about price, liquidity, wallets, DeFi activity, sentiment, or protocol fundamentals.
For this review, each tool was assessed across the following areas
| Criteria | What It Means |
|---|---|
| Data Quality And Reliability | Whether the tool uses dependable data sources and presents them clearly |
| Real-Time And Historical Coverage | Whether users can study current market moves and older cycle patterns |
| Ease Of Use | Whether the interface helps users find answers without getting lost |
| Asset And Chain Coverage | Whether the tool supports enough tokens, chains, protocols, or markets |
| Free Tier Usefulness | Whether the free plan gives enough value before a paid subscription |
| Alerts And Customization | Whether users can create dashboards, alerts, watchlists, or custom views |
| User Fit | Whether the tool suits traders, investors, researchers, DeFi users, or teams |
Pricing did not drive the whole review. The main aim is simple: each tool should make crypto research better. A good dashboard should help users move from “something is happening” to “here is the signal, here is the context, and here is what I should check next.”
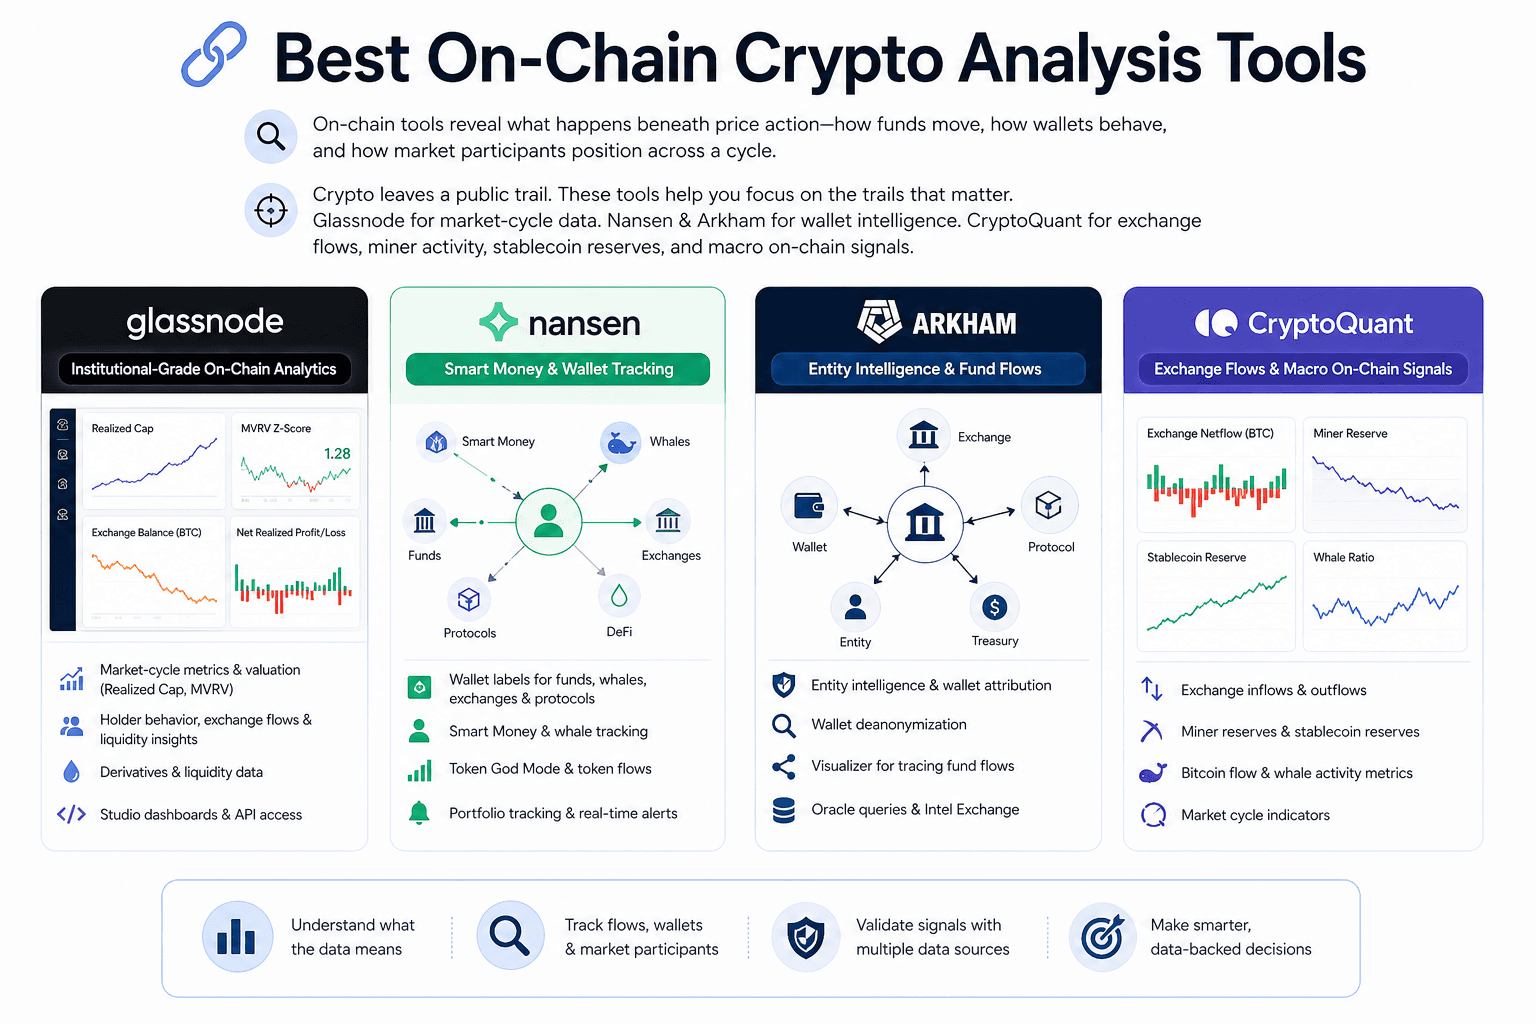
Best On-Chain Crypto Analysis Tools
On-chain crypto analysis tools help readers study what happens beneath price action. They show how funds move, how wallets behave, whether assets flow into exchanges, and how different market participants position themselves across a cycle.
Glassnode helps with market-cycle data. Nansen and Arkham make wallet behavior easier to read. CryptoQuant focuses more on exchange flows, miner activity, stablecoin reserves, and larger market signals.
 Track Wallets, Flows, And Market Behavior On-Chain
Glassnode: Best For Institutional-Grade On-Chain Analytics
Glassnode works well for readers who want a deeper view of Bitcoin and Ethereum market behavior. Its strength lies in cycle analysis, holder patterns, exchange flows, liquidity conditions, and valuation metrics that explain what price alone cannot show.
The platform tracks Bitcoin on-chain data, Ethereum on-chain data, realized cap, MVRV-style metrics, holder behavior, exchange balances, and derivatives data where relevant. These signals help readers judge whether a market looks overheated, underpriced, accumulation-led, or distribution-heavy.
Glassnode Studio gives analysts ready-made dashboards, which helps if they do not want to build models from scratch. Its API makes sense for institutions, funds, and research teams that need to pull market data into internal systems.
Key offerings include:
- Glassnode Studio: A dashboard interface for on-chain charts, market indicators, asset metrics, and cycle analysis.
- Bitcoin and Ethereum Metrics: Data on supply behavior, exchange flows, holder cohorts, realized cap, MVRV, and network activity.
- Market Cycle Indicators: Signals that help users study accumulation, distribution, profit-taking, and stress phases.
- Derivatives and Liquidity Data: Useful context for reading market positioning beyond spot flows.
- API Access: A practical option for teams that want Glassnode data inside reports, models, or internal dashboards.
The drawback is accessibility. Glassnode can feel heavy for newer users because the data often needs context. A realized cap chart or MVRV signal only becomes useful when the reader understands what it says about investor behavior. For serious investors, analysts, and institutions, that depth is the draw.
Nansen: Best For Smart Money And Wallet Tracking
Nansen turns raw wallet activity into something easier to interpret. Instead of forcing users to inspect anonymous addresses one by one, it adds labels that identify Smart Money wallets, whale wallets, funds, exchanges, protocol addresses, and other tracked entities.
That context helps in DeFi. A token can look strong on a price chart, but wallet flows may show early buyers exiting, whales accumulating, or funds rotating into a new narrative. Nansen helps users catch those shifts through wallet labels, Smart Money tracking, token flows, alerts, and portfolio views.
Key offerings include:
- Wallet Labels: Address tags that help users identify funds, whales, exchanges, protocol wallets, and other entities.
- Smart Money Tracking: A way to follow wallets linked to experienced traders, profitable funds, or early movers.
- Whale Wallet Monitoring: Useful for spotting large buys, sells, transfers, and accumulation patterns.
- Token God Mode: A token-level view of holders, flows, exchange movement, and wallet activity.
- Nansen Portfolio: A portfolio view for tracking wallet exposure and DeFi positions across supported networks.
- Alerts: Notifications for key wallet moves, token flows, and address-level activity.
Nansen suits DeFi traders, active investors, and teams that care about wallet behavior. It is less useful for someone who only wants market prices or simple charts. Its value comes from showing who is moving, not only what moved.
Arkham: Best For Entity Intelligence And Fund Flows
Arkham focuses on the identity layer of blockchain activity. It helps users connect wallets to entities with available attribution, then track how funds move between addresses, exchanges, protocols, and known clusters.
The platform is useful when a reader wants to understand fund movement at the entity level. Researchers can use it to follow large transfers, protocol treasury movements, hacked funds, exchange flows, or whale-linked activity. Transparency-focused traders can use it to check whether a market-moving wallet belongs to a known entity or an unknown address cluster.
Key offerings include:
- Entity Intelligence: Wallet and address attribution that helps users connect on-chain activity to known entities.
- Wallet Deanonymization: A research layer for identifying address clusters where public attribution is available.
- Arkham Visualizer: A visual map to trace fund flows among wallets, exchanges, protocols, and entities.
- Arkham Oracle: A query tool for address, transaction, and entity-level blockchain questions.
- Intel Exchange: A marketplace where users can request or provide blockchain intelligence.
- ARKM Token: Arkham’s native token, tied to parts of its intelligence marketplace and platform economy.
The caution is that wallet labels are helpful, but they are not the perfect truth. Entity intelligence depends on available attribution, and users should avoid treating every wallet connection as a final answer. Arkham works best as an investigation tool alongside Nansen, DeBank, block explorers, and other on-chain sources.
CryptoQuant: Best For Exchange Flows And Macro On-Chain Signals
CryptoQuant is strongest when the question is about market pressure. Are coins moving into exchanges? Are miners selling? Are stablecoin reserves rising? Are whales sending funds toward venues where they can trade?
Its core data covers exchange inflows, exchange outflows, miner reserves, stablecoin reserves, Bitcoin flows, whale activity, and market-cycle indicators. These metrics help traders understand whether price action has support from deeper market behavior.
Exchange flows are especially useful. Rising exchange inflows can point to higher sell-side risk, since coins are moving toward trading venues. Persistent outflows may suggest custody, accumulation, or lower immediate selling pressure. Neither signal works alone, but both can sharpen market reading when paired with price and derivatives data.
Key offerings include:
- Exchange Inflows And Outflows: Data showing whether coins are moving toward or away from centralized exchanges.
- Miner Reserves: A useful view of whether miners are holding, distributing, or sending coins to exchanges.
- Stablecoin Reserves: Liquidity data that can show whether trading capital is building on exchanges.
- Bitcoin Flow Metrics: Market-cycle signals focused on BTC movement, holder behavior, and exchange activity.
- Whale and Institutional Flow Indicators: Data that helps users track large-wallet behavior and heavier market participants.
- Market Cycle Indicators: Metrics designed to help users read overheated, fearful, or accumulation-heavy periods.
CryptoQuant is useful for Bitcoin-focused traders, macro crypto analysts, and investors who want on-chain signals without building custom dashboards. Its limitation is the same one most signal platforms face: one metric rarely tells the whole story. Exchange flows, miner reserves, stablecoin data, and whale activity need confirmation from charts, liquidity, Open Interest, Funding Rates, and market context.
Best DeFi Analytics Tools
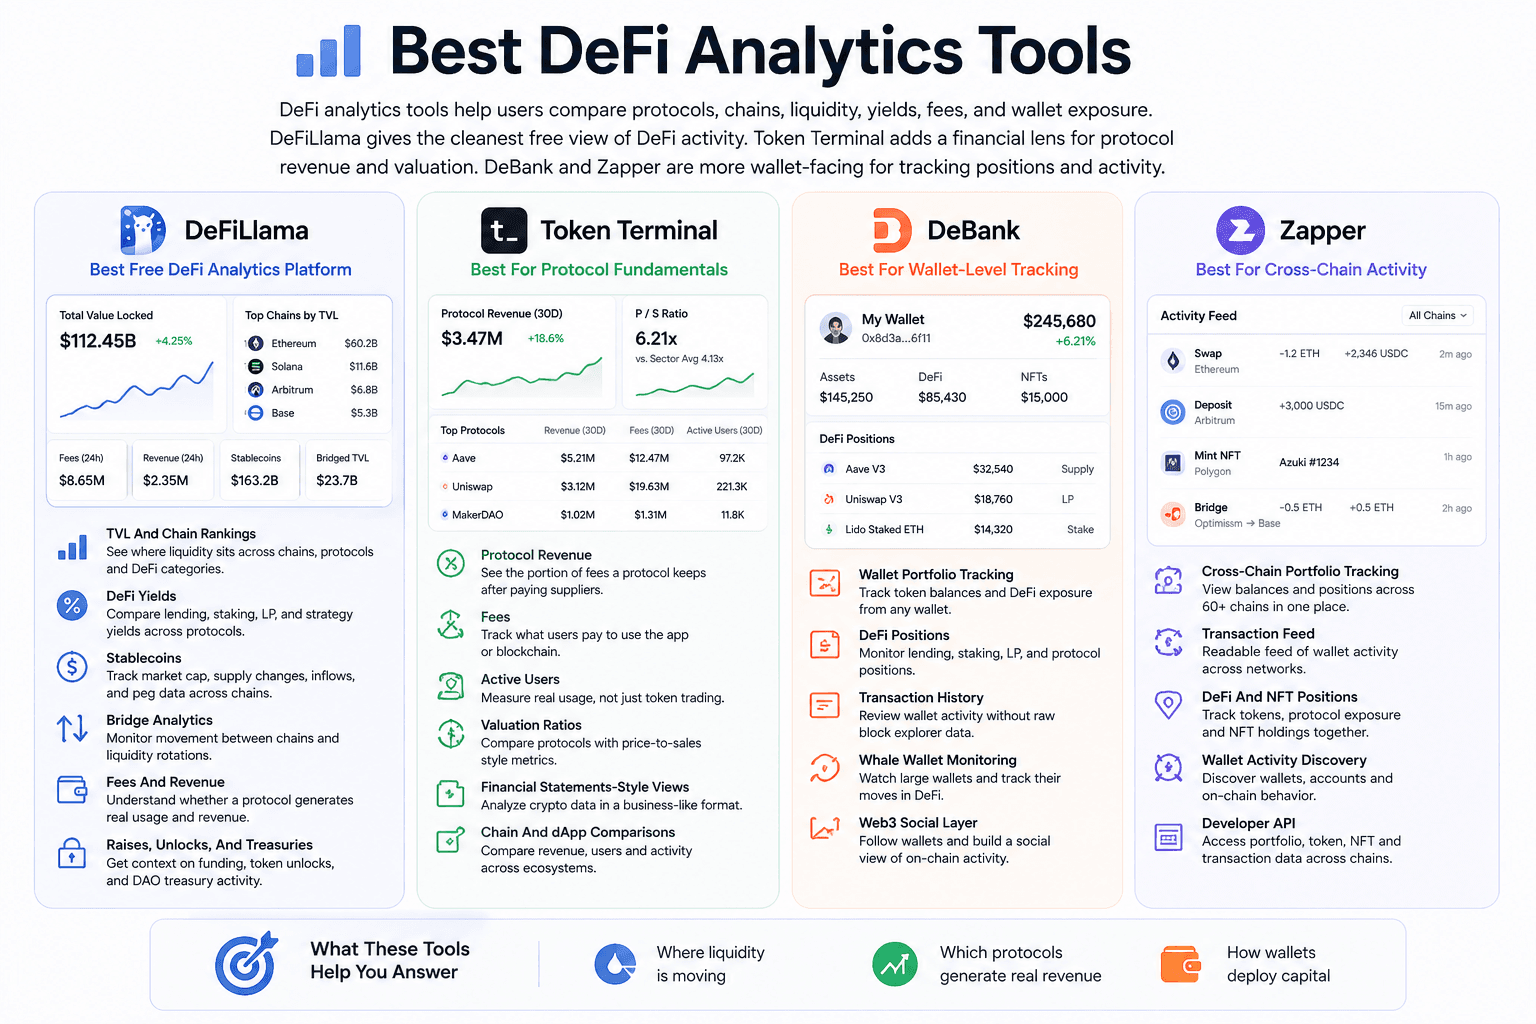
DeFi analytics tools help users compare protocols, chains, liquidity, yields, fees, and wallet exposure.
DeFiLlama gives the cleanest free view of DeFi activity across chains. Token Terminal adds a financial lens for protocol revenue and valuation. DeBank and Zapper are more wallet-facing, which makes them useful for tracking personal positions or watching how other wallets move through DeFi.
 Read DeFi Liquidity, Yields, Revenue, And Protocol Activity
DeFiLlama: Best Free DeFi Analytics Platform
DeFiLlama is one of the strongest starting points for DeFi research because it covers a lot without locking basic data behind a paywall. Users can track Total Value Locked, protocol rankings, chain activity, yields, stablecoins, bridges, fees, revenue, raises, treasuries, and unlocks from one place. Its dashboard tracks TVL, revenue, fees, volume, and yields across thousands of DeFi protocols and hundreds of chains.
The main use case is comparison. A reader can check whether liquidity is growing on Ethereum, Solana, Base, Arbitrum, or another chain. They can compare lending protocols, DEXs, liquid staking platforms, bridges, and yield markets without jumping between several block explorers.
Useful DeFiLlama areas include:
- TVL and Chain Rankings: Shows where liquidity sits across chains, protocols, and DeFi categories.
- DeFi Yields: Helps users compare lending, staking, liquidity pool, and strategy-based returns.
- Stablecoins: Tracks stablecoin market cap, supply changes, inflows, and peg-related data across chains.
- Bridge Analytics: Shows movement between chains, which is useful when liquidity rotates across ecosystems.
- Fees and Revenue: Gives a cleaner read on whether a protocol is generating real usage.
- Raises, Unlocks, and Treasuries: Adds context around funding, token supply pressure, and DAO resources.
The reason DeFiLlama stands out is that it gives users enough data to form a first opinion before paying for anything. It will not replace deep on-chain research, but it is one of the best free crypto tools for reading DeFi at the ecosystem level.
Token Terminal: Best For Protocol Fundamentals
Token Terminal looks at crypto protocols through business-style metrics. Instead of only asking whether a token price is rising, it helps users ask whether the protocol earns fees, retains revenue, attracts users, and trades at a reasonable valuation compared with other projects.
This makes it especially useful for investors who want to analyze DApps, DAOs, and blockchains with a fundamentals-first approach. Token Terminal tracks metrics such as protocol revenue, fees, active users, earnings, valuation ratios, and financial statements-style crypto data. Its own positioning focuses on measuring blockchains and DApps through traditional financial metrics.
Useful Token Terminal areas include:
- Protocol Revenue: Shows the portion of fees a project keeps after payments to supply-side participants.
- Fees: Tracks what users pay to use an application or blockchain.
- Active Users: Gives a cleaner view of whether people are using the product, not only trading the token.
- Valuation Ratios: Helps compare protocols using metrics such as price-to-sales ratios.
- Financial Statements-Style Views: Organizes crypto data in a format closer to business analysis.
- Chain and dApp Comparisons: Useful for comparing revenue, users, and activity across ecosystems.
Token Terminal pairs well with DeFiLlama. DeFiLlama can show where liquidity is going, while Token Terminal helps users judge whether that activity is producing fees, revenue, or user growth. That combination is valuable for investors who want more than TVL charts.
DeBank: Best For Wallet-Level DeFi Portfolio Tracking
DeBank is built around wallet visibility. It helps users track tokens, DeFi positions, NFTs, transaction history, and wallet activity across supported EVM networks. Its mobile listing describes it as a Web3 portfolio tracker covering tokens, DeFi protocols, and NFTs across EVM chains.
The platform works well when the research question starts with a wallet. A user may want to check their own exposure across lending markets, LP positions, staked assets, and token balances. They may also want to monitor a whale wallet, a fund wallet, or a public address linked to an active DeFi participant.
Useful DeBank areas include:
- Wallet Portfolio Tracking: Shows token balances and DeFi exposure from a connected wallet or public address.
- DeFi Positions: Helps users track lending, staking, liquidity pool, and protocol-level positions.
- Transaction History: Makes wallet activity easier to review without digging through raw block explorer pages.
- Whale Wallet Monitoring: Useful for watching how larger wallets enter, exit, or rotate through DeFi.
- Web3 Social Layer: Lets users follow wallets and build a more social view of on-chain activity.
DeBank is not the place to start if you want protocol-wide TVL or revenue rankings. Its stronger use is wallet-level context. It helps answer a more practical question: what does this wallet actually hold, and where is that capital deployed?
Zapper: Best For Human-Readable Cross-Chain Activity
Zapper makes on-chain activity easier to follow for users who want a cleaner wallet and activity feed experience. Its main site focuses on real-time on-chain transactions and account discovery, while its developer platform offers portfolio, token, NFT, and transaction data across more than 60 chains through a GraphQL API.
For regular users, Zapper is useful because it turns scattered wallet activity into a more readable feed. Users can track DeFi positions, NFT holdings, token balances, and wallet activity across chains without treating every transaction like a mini forensic exercise.
Useful Zapper areas include:
- Cross-Chain Portfolio Tracking: Brings wallet balances and positions from different networks into one view.
- Transaction Feed: Presents wallet activity in a more readable format than raw explorer data.
- DeFi and NFT Positions: Helps users monitor tokens, protocol exposure, and NFT holdings together.
- Wallet Activity Discovery: Useful for following wallets, accounts, and on-chain behavior.
- Developer API: Gives teams access to portfolio, token price, NFT, and transaction data across supported chains.
Zapper is best seen as a readability layer for on-chain activity. DeFiLlama and Token Terminal are stronger for protocol research. DeBank and Zapper are more useful when the question starts with a wallet, a portfolio, or a stream of on-chain actions.
Best Crypto Market Data Aggregators
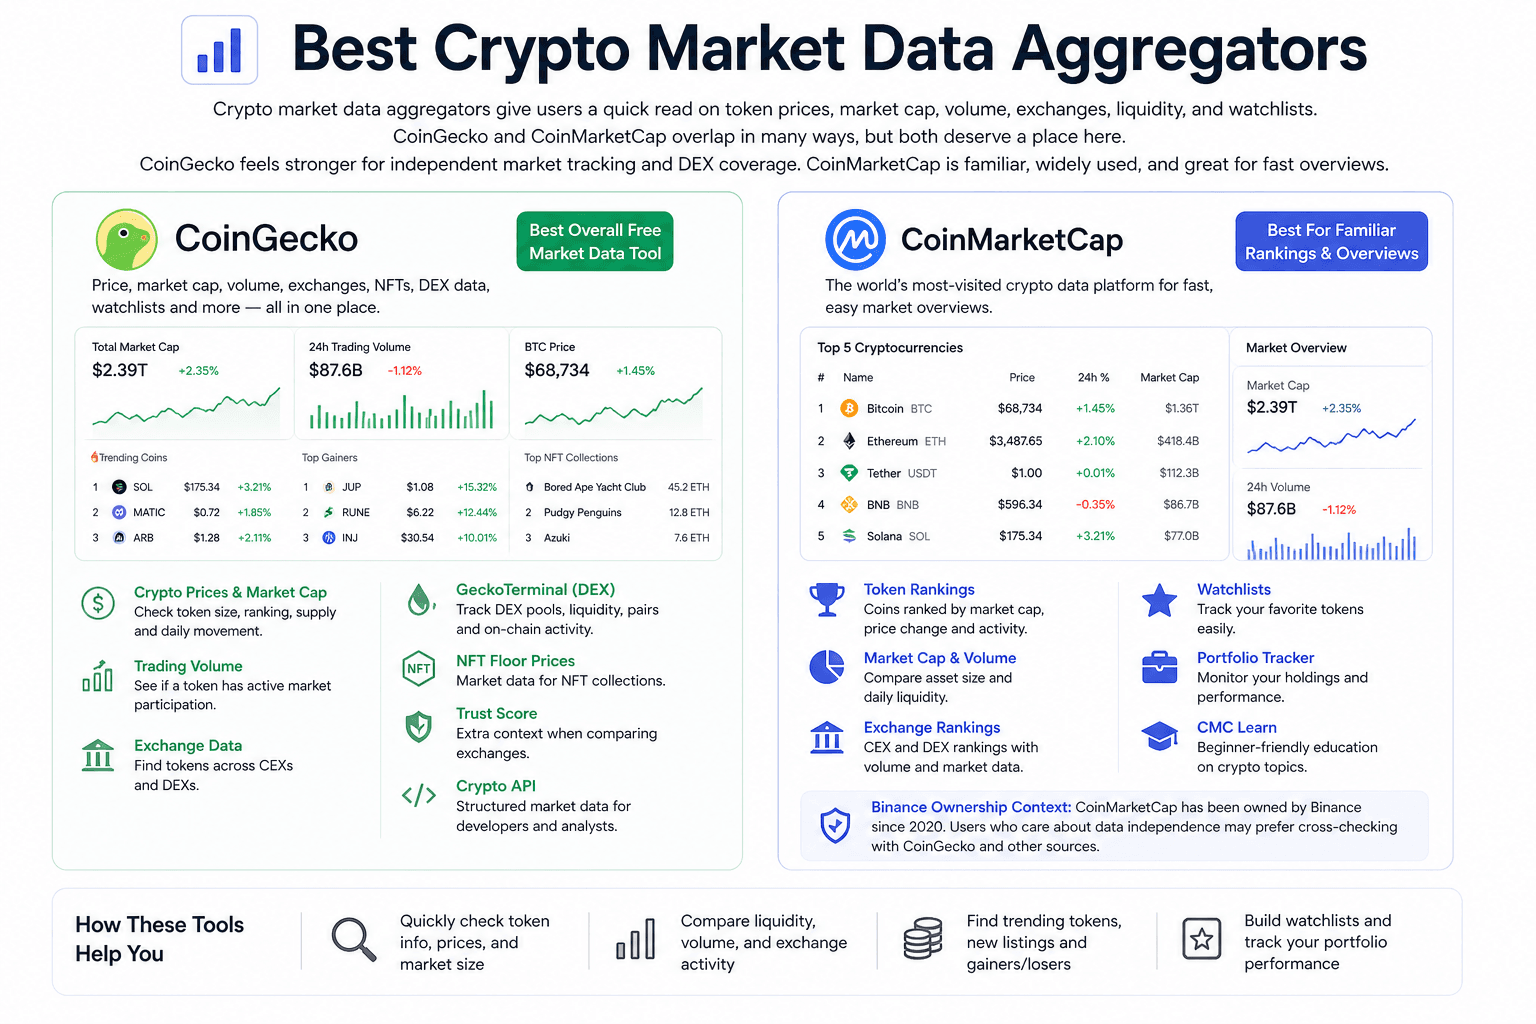
Crypto market data aggregators give users a quick read on token prices, market cap, volume, exchanges, liquidity, and watchlists.
CoinGecko and CoinMarketCap overlap in many ways, but both deserve a place here. CoinGecko feels stronger for independent market tracking and deeper DEX coverage through GeckoTerminal. CoinMarketCap remains familiar, widely used, and useful for fast token rankings, portfolio tools, and simple market overviews.
 Follow Token Prices, Volume, Rankings, And Exchange Data
CoinGecko: Best Overall Free Market Data Tool
CoinGecko is one of the easiest tools to start with because it gives users price, market cap, volume, exchange, NFT, and DEX data without making the experience feel too technical. It works for quick checks, but it also has enough depth for users who want more than a price page.
The platform covers token prices, market capitalization, trading volume, exchange listings, categories, watchlists, trending tokens, NFT floor prices, and API access. GeckoTerminal adds a stronger DEX layer by letting users track pools, tokens, and on-chain trading activity across decentralized exchanges.
For everyday research, these are the parts readers will use most:
- Crypto Prices and Market Cap: Helps users check token size, ranking, circulating supply, and daily movement.
- Trading Volume: Shows whether a token has active market participation or thin activity.
- Exchange Data: Lists where a token trades across centralized and decentralized venues.
- GeckoTerminal: Tracks DEX pools, liquidity, pair data, and on-chain token activity.
- NFT Floor Prices: Adds market data for NFT collections alongside token data.
- Trust Score: Gives users extra context when comparing exchanges.
- Crypto API: Supports teams, developers, and analysts who need structured market data.
CoinGecko works well as the first research layer. It will not replace Glassnode for on-chain analytics or TradingView for deeper charting, but it gives readers enough context before they move into more specific tools.
Read our full CoinGecko review.
CoinMarketCap: Best For Familiar Token Rankings And Market Overviews
CoinMarketCap is still one of the most recognized crypto market data platforms. Many users start there because its token rankings, price pages, market cap data, exchange rankings, watchlists, and portfolio tracker are easy to understand.
The platform is helpful when someone wants a fast view of the market. A reader can check top tokens, trending coins, newly listed assets, exchange data, categories, gainers, losers, and basic project information from one place. CMC Learn adds education content for users who want simpler explainers around crypto terms, sectors, and project types.
Its strongest everyday use cases are straightforward:
- Token Rankings: Gives users a familiar view of coins by market cap, price change, and trading activity.
- Crypto Market Cap and Volume: Helps compare asset size and daily liquidity.
- Exchange Rankings: Shows centralized and decentralized exchanges with volume and market data.
- Watchlists: Let users track selected tokens without building a separate spreadsheet.
- Portfolio Tracker: Helps users monitor holdings and performance in one place.
- CMC Learn: Offers beginner-friendly education around crypto markets and concepts.
- Binance Ownership Context: CoinMarketCap has been owned by Binance since 2020, so users who care about data independence may prefer checking CoinGecko alongside it.
CoinMarketCap is useful because it is familiar, fast, and easy to scan. For deeper analysis, users should treat it as a starting point rather than the full research layer. Cross-checking token data, exchange volume, and liquidity across CoinGecko, TradingView, and DEX-specific tools can give a cleaner view.
Best Crypto Research Platforms
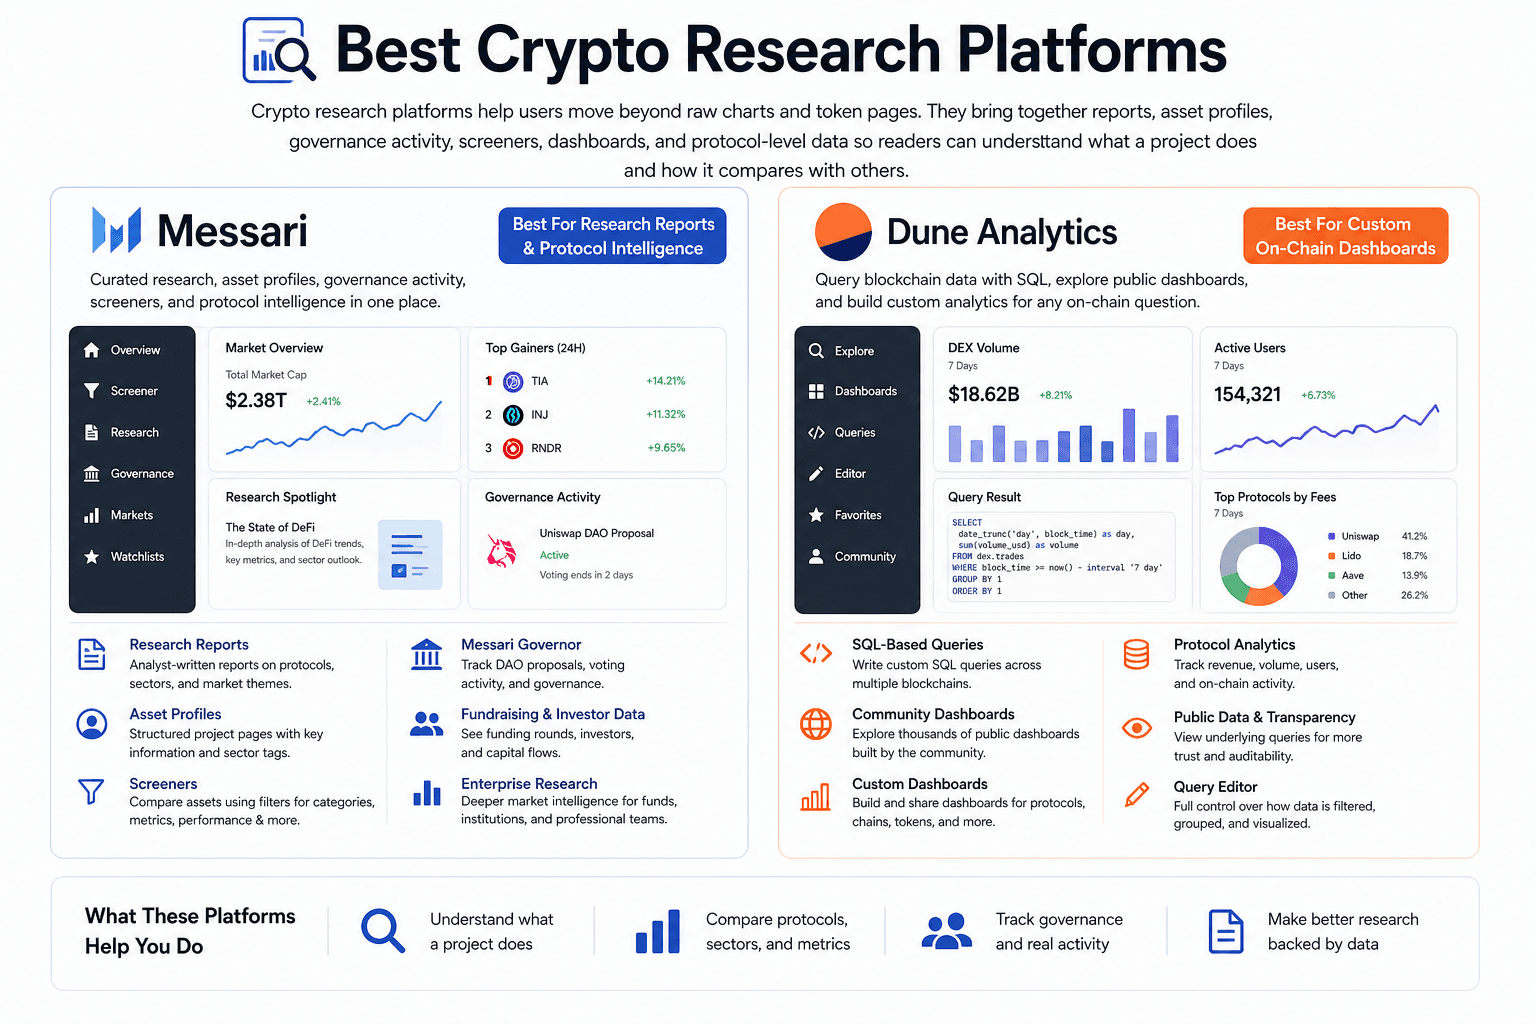
Crypto research platforms help users move beyond raw charts and token pages. They bring together reports, asset profiles, governance activity, screeners, dashboards, and protocol-level data.
Messari is stronger for curated research and structured protocol intelligence. Dune gives users more freedom to query blockchain data directly and build custom dashboards. One is closer to an analyst's desk. The other is closer to a public data lab.
 Use Reports And Dashboards For Stronger Protocol Research
Messari: Best For Research Reports And Protocol Intelligence
Messari works well for investors, analysts, and teams that want organized crypto research without building every view from raw data. Its value comes from combining asset profiles, sector coverage, screeners, protocol reports, fundraising data, governance tracking, and enterprise research in one place.
The platform is especially useful when readers need context around a project, not only its price. A Messari profile can help users check what a protocol does, which sector it belongs to, how its token works, who funds it, and what major events or governance decisions may affect it.
Readers will usually get the most from:
- Research Reports: Analyst-written coverage on protocols, sectors, market themes, and major crypto trends.
- Asset Profiles: Structured project pages with token information, sector tags, and key background.
- Screeners: Filters for comparing assets by category, performance, metrics, and other data points.
- Messari Governor: A governance tracker for DAOs, proposals, voting activity, and protocol decisions.
- Fundraising and Investor Data: Helpful context for understanding backing, capital flows, and project maturity.
- Enterprise Research: Deeper market intelligence for funds, institutions, and professional research teams.
Messari is a better fit for users who want curated research rather than a wall of raw blockchain data. It can save time when comparing protocols, preparing reports, or studying a sector. The limitation is that some of its strongest features sit behind paid plans, so casual users may only get part of the experience.
Dune Analytics: Best For Custom On-Chain Dashboards
Dune Analytics gives analysts direct access to blockchain data through SQL queries and public dashboards. It is one of the most flexible tools in crypto because users can inspect on-chain activity, build dashboards, and share research with the wider community.
The platform is especially useful for questions that standard dashboards do not answer cleanly. A user might want to track protocol revenue, NFT activity, DEX volume, bridge flows, stablecoin supply, wallet cohorts, governance participation, or chain-specific adoption. If the data exists on supported chains and the query is built properly, Dune can turn it into a readable dashboard.
The platform is built around a few core workflows:
- SQL-Based Blockchain Queries: Let users write custom queries for on-chain data across supported networks.
- Community Dashboards: Gives beginners and researchers access to public dashboards built by other analysts.
- Custom Dashboards: Helps teams create views for protocols, chains, tokens, apps, and market segments.
- Protocol Analytics: Useful for tracking usage, revenue, volume, users, and contract-level activity.
- Public Data Queries: Makes crypto data easier to audit because many dashboards show the underlying query.
- Query Editor: Gives technical users control over how data is filtered, grouped, and visualized.
Dune has a learning curve. Beginners may prefer using existing dashboards before trying to write their own SQL. For analysts, developers, researchers, and protocol teams, that flexibility is exactly why the platform is so useful. It lets users ask sharper questions than most ready-made dashboards allow.
Best Crypto Sentiment And Behavioral Analysis Tools
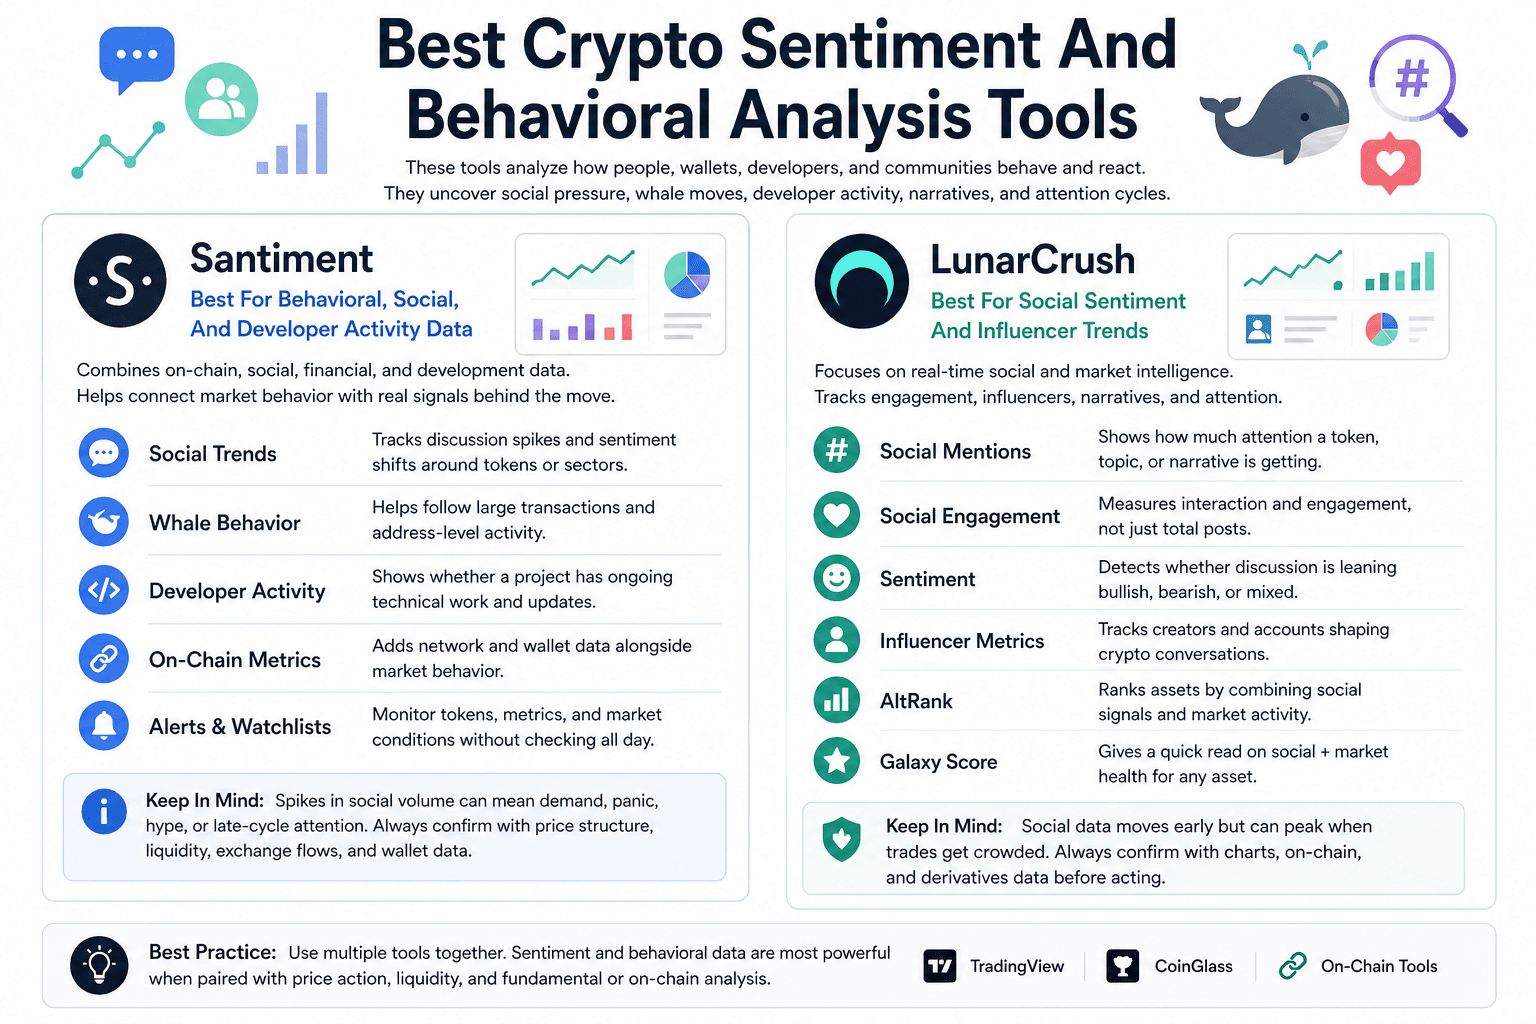
Crypto sentiment and behavioral analysis tools help readers study how people, wallets, developers, and online communities react before or during market moves.
Santiment gives a more mixed data view because it combines on-chain, social, financial, and development metrics. LunarCrush is more focused on social momentum, influencer activity, engagement, and narrative tracking.
 Measure Social Attention, Whale Moves, And Developer Activity
Santiment: Best For Behavioral, Social, And Developer Activity Data
Santiment is useful when readers want to connect market behavior with social and on-chain signals. The platform covers financial, on-chain, and social datasets, along with screeners, watchlists, alerts, chart layouts, and community insights. Its app also highlights financial health, social buzz, on-chain activity, whale transactions, and development activity dashboards.
That mix makes Santiment helpful when a token’s price move needs more context. A chart may show a breakout, but Santiment can help users check whether social volume is overheating, whales are active, developers are still shipping, or exchange-related signals are changing.
For practical research, readers will likely use Santiment for:
- Social Trends: Tracks discussion spikes and sentiment shifts around tokens or sectors.
- Whale Behavior: Helps users follow large transactions and address-level activity.
- Developer Activity: Gives another way to judge whether a project has ongoing technical work.
- On-Chain Metrics: Adds network and wallet data alongside market behavior.
- Alerts and Watchlists: Helps users monitor tokens, metrics, and market conditions without checking charts all day.
Santiment works best for users who want sentiment plus behavioral signals, rather than pure social media noise. The main caution is interpretation. A spike in social volume can mean genuine demand, panic, coordinated hype, or late-cycle crowd attention. It becomes more useful when paired with price structure, liquidity, exchange flows, and wallet data.
LunarCrush: Best For Social Sentiment And Influencer Trends
LunarCrush is built around real-time social and market intelligence. Its platform tracks social media analytics, engagement, market activity, trending topics, and influencer or creator impact across crypto assets. LunarCrush also uses Galaxy Score to combine social engagement and market performance, while AltRank ranks assets using social and market signals.
This makes LunarCrush useful for narrative tracking. If a token starts spreading across social platforms before price fully reacts, LunarCrush can help readers check whether attention is building, which creators are driving it, and whether engagement looks isolated or market-wide.
The platform is mainly useful for:
- Social Mentions: Shows how much attention a token, topic, or narrative is getting.
- Social Engagement: Measures whether posts are getting interaction, not only being published.
- Sentiment: Helps users see whether market discussion leans bullish, bearish, or mixed.
- Influencer Metrics: Tracks creators and accounts shaping crypto conversations.
- AltRank: Ranks assets by combining social and market activity.
- Galaxy Score: Gives a quick read on social and market health for an asset.
LunarCrush is strongest for social momentum, memecoin cycles, narrative trading, and attention-driven markets. It should not be treated as a buy or sell signal by itself. Social data can move early, but it can also peak when a trade is already crowded. The cleaner workflow is to use LunarCrush for attention signals, then confirm with TradingView, CoinGlass, Santiment, or on-chain tools before acting.
Best Crypto Charting And Technical Analysis Tools
Crypto charting tools help traders read price structure, momentum, volume, trend strength, and key levels. They are useful when the main question is simple: where is the price now, where are buyers or sellers reacting, and what would confirm or weaken the setup?
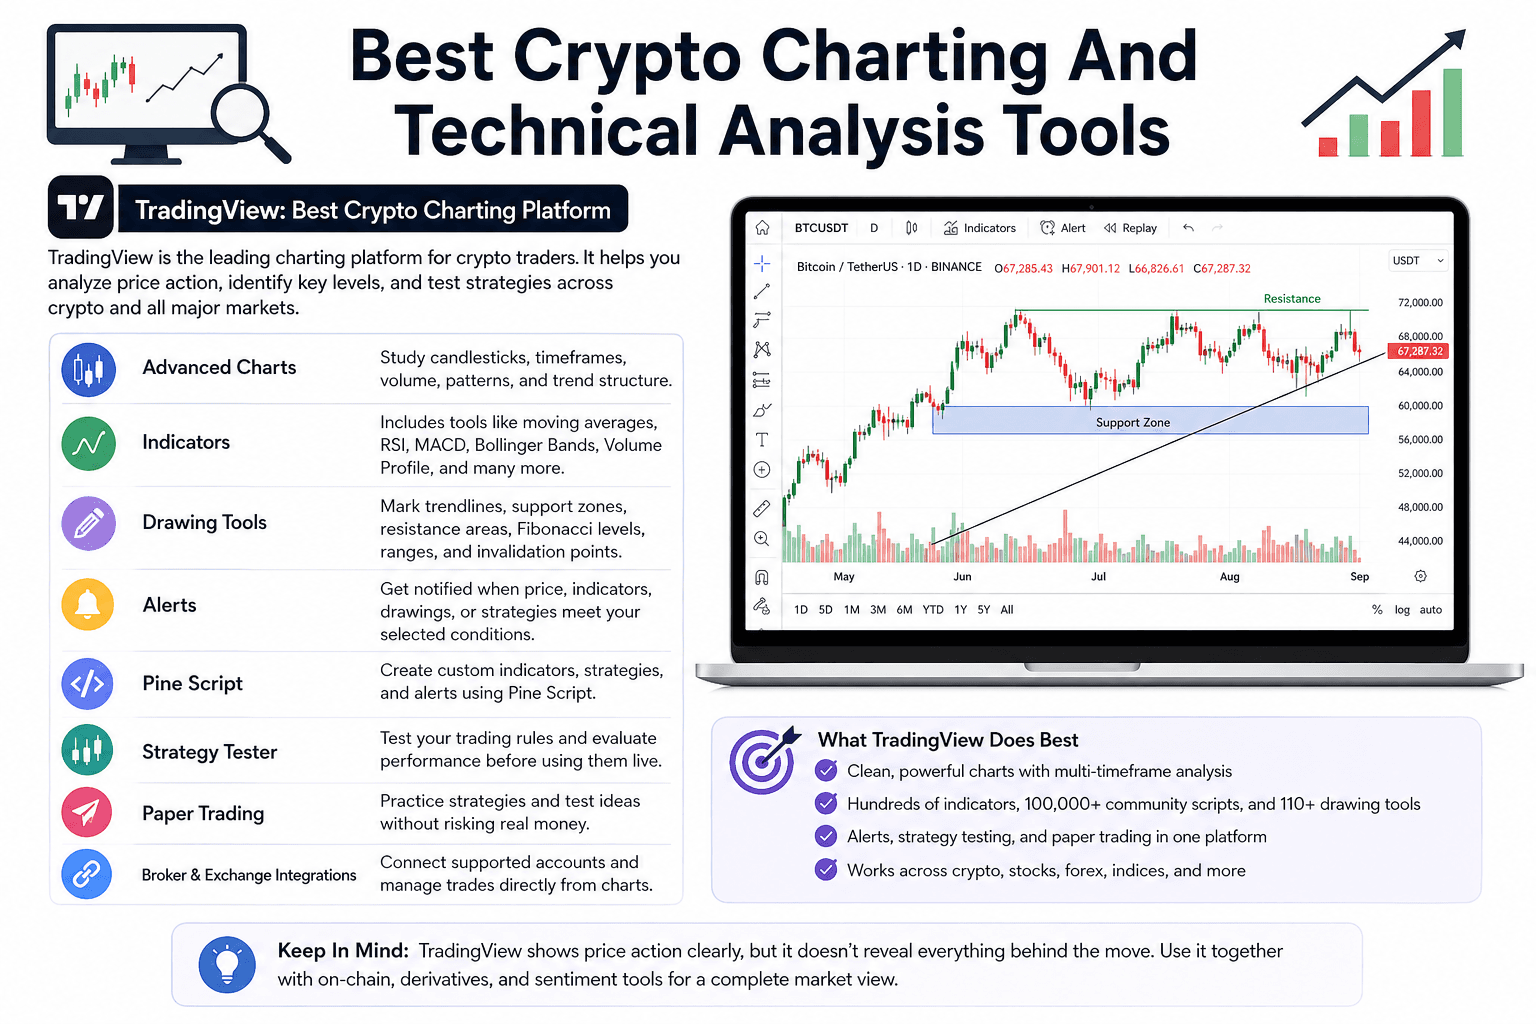
TradingView dominates this category because it combines charts, indicators, drawing tools, alerts, strategy testing, community scripts, and broker or exchange integrations in one platform. Its official features page lists hundreds of built-in indicators and strategies, more than 100,000 public indicators, over 110 drawing tools, candlestick pattern recognition, multi-timeframe analysis, and auto chart patterns.
 Study Price Trends, Indicators, Alerts, And Trading Setups
TradingView: Best Crypto Charting Platform
TradingView is the charting platform most crypto traders already know. It covers crypto assets alongside stocks, indices, forex, commodities, and other markets, which makes it useful for traders who want to compare Bitcoin, altcoins, DXY, equities, and macro charts from one workspace.
Its crypto use case is straightforward. A trader can open a BTC, ETH, SOL, or altcoin chart, add indicators, draw support and resistance zones, set alerts, test a strategy, and save watchlists. This makes TradingView useful for day traders, swing traders, technical analysts, and writers who need cleaner chart context before explaining a market move.
The platform's strongest parts are easy to understand:
- Advanced Charts: Let users study candlesticks, timeframes, volume, patterns, and trend structure.
- Indicators: Includes built-in tools such as moving averages, RSI, MACD, Bollinger Bands, Volume Profile, and many others.
- Drawing Tools: Helps traders mark trendlines, support zones, resistance areas, Fibonacci levels, ranges, and invalidation points.
- Alerts: Let users receive notifications when price, indicators, drawings, or strategies meet selected conditions.
- Pine Script: Allows users to create custom indicators, strategies, and alerts inside TradingView.
- Strategy Tester: Helps traders test rules before using them in live markets.
- Paper Trading: Let users practice trading methods and test ideas without risking real funds.
- Broker and Exchange Integrations: Allows supported users to connect trading accounts and manage trades from the charting interface.
TradingView’s free plan is strong enough for basic charting, watchlists, and simple technical analysis. Paid plans become more useful when a trader needs more alerts, more indicators per chart, multiple layouts, deeper backtesting features, or heavier workflow customization. TradingView’s pricing page lists features such as active price alerts, technical alerts, Pine Script, backtesting, Deep Backtesting, watchlists, and strategy data export across plans.
The limitation is that TradingView shows price action clearly, but it does not explain everything behind the move. A breakout may look strong on the chart, yet CoinGlass could show crowded leverage, CryptoQuant could show exchange inflows, or Santiment could show overheated social activity. TradingView works best as the charting layer in a wider crypto research stack, especially when paired with on-chain, derivatives, and sentiment tools.
Are you a pro trader? Have a look at the top crypto trading strategies.
Best Crypto Derivatives Analysis Tools
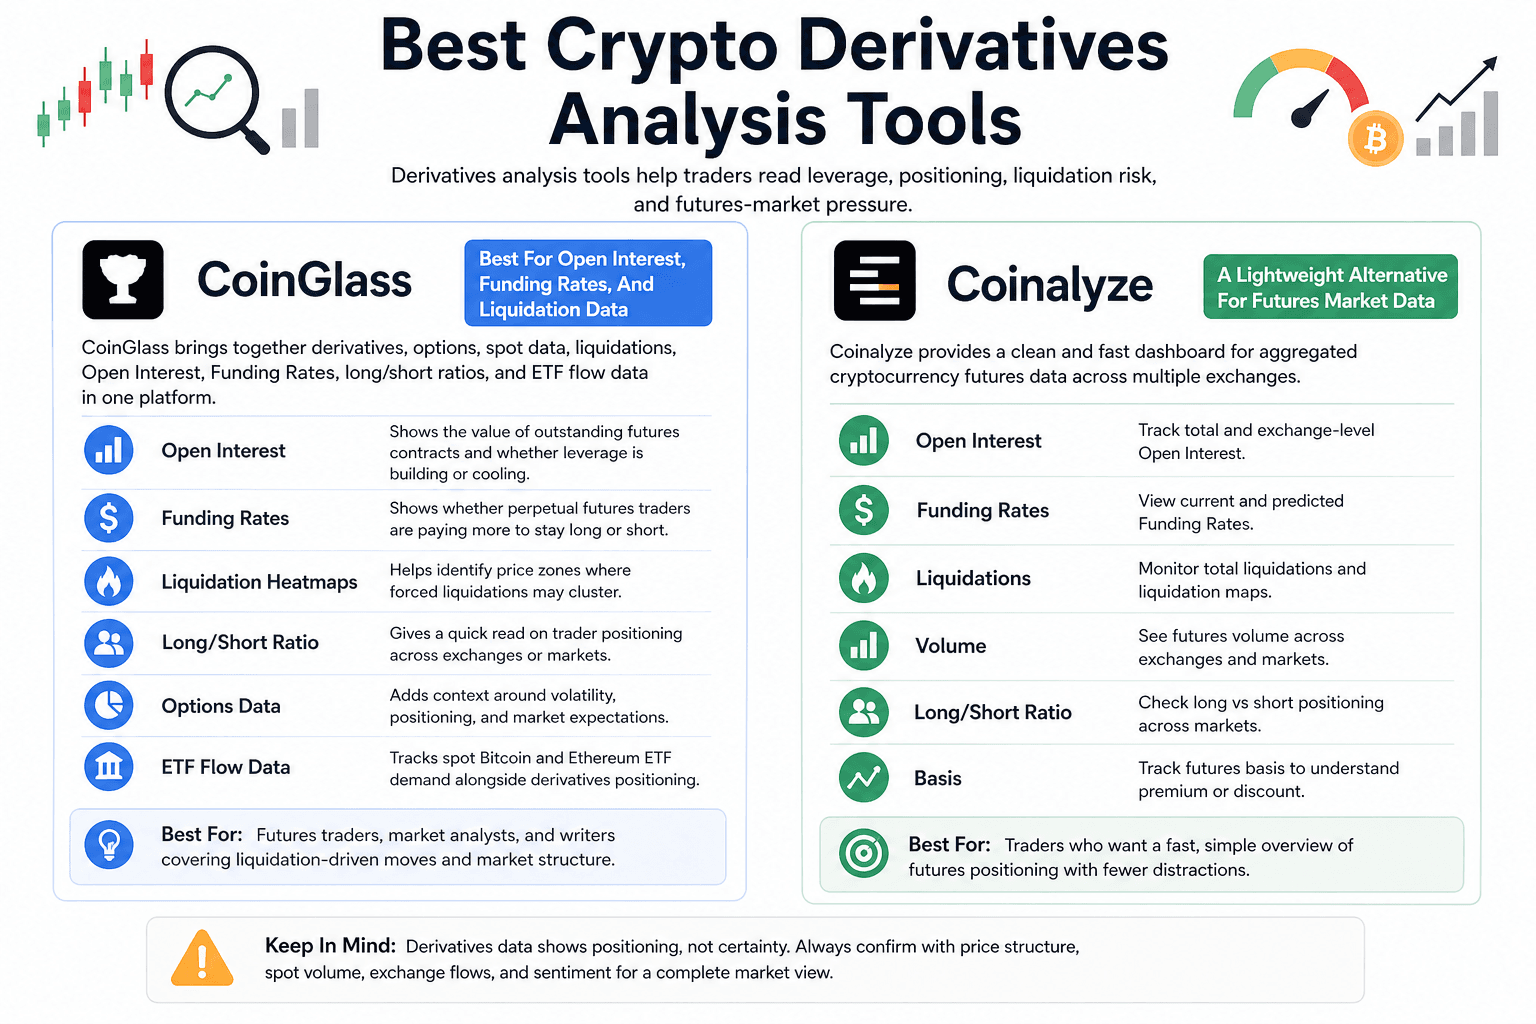
Crypto derivatives analysis tools help traders read leverage, positioning, liquidation risk, and futures-market pressure. This category is useful when price action looks strong or weak, but traders need to know whether the move is supported by healthy positioning or crowded leverage.
CoinGlass is a must-know tool here because it brings together open interest, funding rates, liquidations, long/short ratios, options data, and ETF flow views in one place. Coinalyze is worth mentioning as a lighter alternative for futures data, especially for users who want a cleaner dashboard around Open Interest, Funding Rates, liquidations, volume, and basis.
 Read Open Interest, Funding Rates, And Liquidation Risk
CoinGlass: Best For Open Interest, Funding Rates, And Liquidation Data
CoinGlass is built for traders who want to understand market positioning before entering or explaining a trade. It tracks derivatives, options, spot-market data, liquidations, Open Interest, Funding Rates, long/short ratios, and other market structure signals.
The platform is especially useful when leverage starts driving price. A token may be rallying on the chart, but rising Open Interest and aggressive Funding Rates can show that the move is becoming crowded. On the other side, heavy liquidations can explain why a sharp price move accelerates once leveraged traders get forced out.
Traders usually turn to CoinGlass for a few core reads:
- Open Interest: Shows the value of outstanding futures contracts and helps traders judge whether leverage is building or cooling.
- Funding Rates: Shows whether perpetual futures traders are paying more to stay long or short.
- Liquidation Heatmaps: Helps identify price zones where forced liquidations may cluster.
- Long/Short Ratio: Gives a quick read on trader positioning across selected exchanges or markets.
- Options Data: Adds context around volatility, positioning, and market expectations where available.
- ETF Flow Data: Useful for tracking spot Bitcoin and Ethereum ETF demand alongside derivatives positioning.
CoinGlass works best for futures traders, market analysts, and writers covering liquidation-driven moves.
Coinalyze: A Lightweight Alternative For Futures Market Data
Coinalyze is a useful alternative for traders who want a simpler futures-market dashboard. It tracks aggregated cryptocurrency futures data, including open interest, funding rates, predicted funding rates, liquidations, volume, long/short ratio, and basis.
Its main appeal is speed. Traders can quickly compare futures positioning across assets and exchanges without getting pulled into a heavier analytics setup. That makes it helpful for checking whether a move has enough derivative participation behind it or whether leverage is starting to look stretched.
Coinalyze works better as a supporting tool than a full research stack. CoinGlass has the broader name recognition and a larger derivatives feature set, while Coinalyze gives traders a clean way to monitor futures data when they want fewer distractions.
Best Free Crypto Analysis Tools
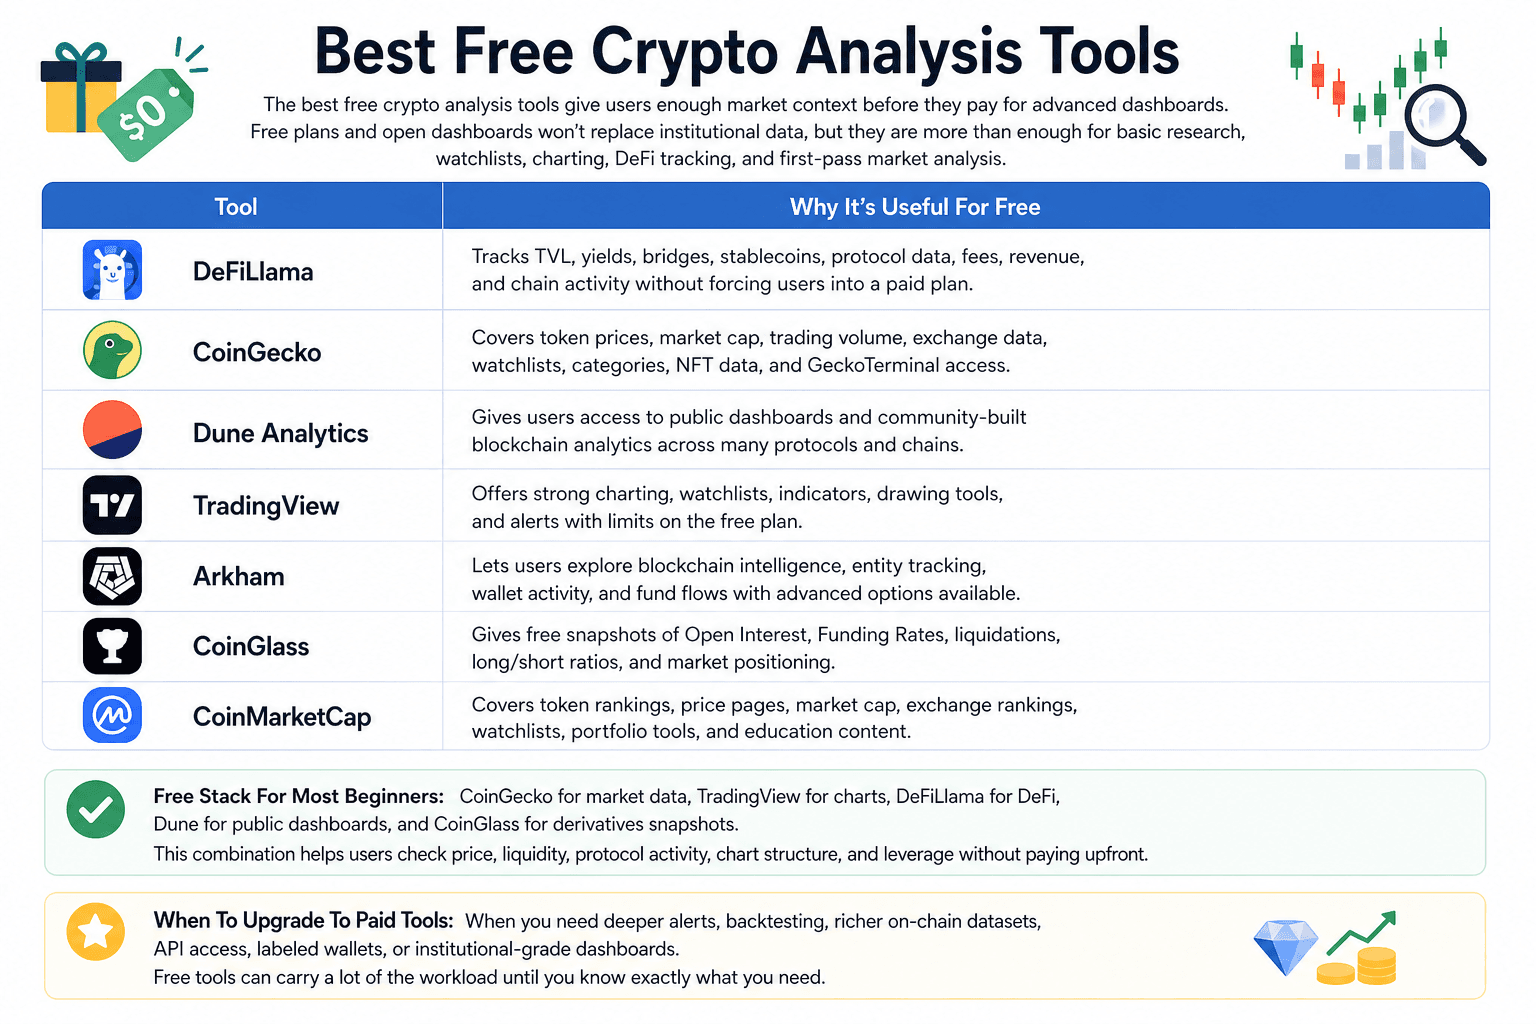
The best free crypto analysis tools give users enough market context before they pay for advanced dashboards. Free plans and open dashboards will not replace institutional data, but they are more than enough for basic research, watchlists, charting, DeFi tracking, and first-pass market analysis.
 Start Crypto Research Without Paying For Advanced Dashboards
| Tool | Why It’s Useful For Free |
|---|---|
| DeFiLlama | Tracks TVL, yields, bridges, stablecoins, protocol data, fees, revenue, and chain activity without forcing users into a paid plan. |
| CoinGecko | Covers token prices, market cap, trading volume, exchange data, watchlists, categories, NFT data, and GeckoTerminal access. |
| Dune Analytics | Gives users access to public dashboards and community-built blockchain analytics across many protocols and chains. |
| TradingView | Offers strong charting, watchlists, indicators, drawing tools, and alerts with limits on the free plan. |
| Arkham | Let's users explore blockchain intelligence, entity tracking, wallet activity, and fund flows with advanced options available. |
| CoinGlass | Gives free snapshots of Open Interest, Funding Rates, liquidations, long/short ratios, and market positioning. |
| CoinMarketCap | Covers token rankings, price pages, market cap, exchange rankings, watchlists, portfolio tools, and education content. |
For most, this free stack is enough: CoinGecko for market data, TradingView for charts, DeFiLlama for DeFi, Dune for public dashboards, and CoinGlass for derivatives snapshots. That combination helps users check price, liquidity, protocol activity, chart structure, and leverage without paying upfront.
Paid tools become more useful once the user knows exactly what they need. A trader may upgrade for deeper alerts or backtesting. An analyst may pay for richer on-chain datasets. A DeFi team may need API access, labeled wallets, or institutional-grade dashboards. Until that point, free tools can carry a lot of the workload.
Best Crypto Analysis Tools For Beginners
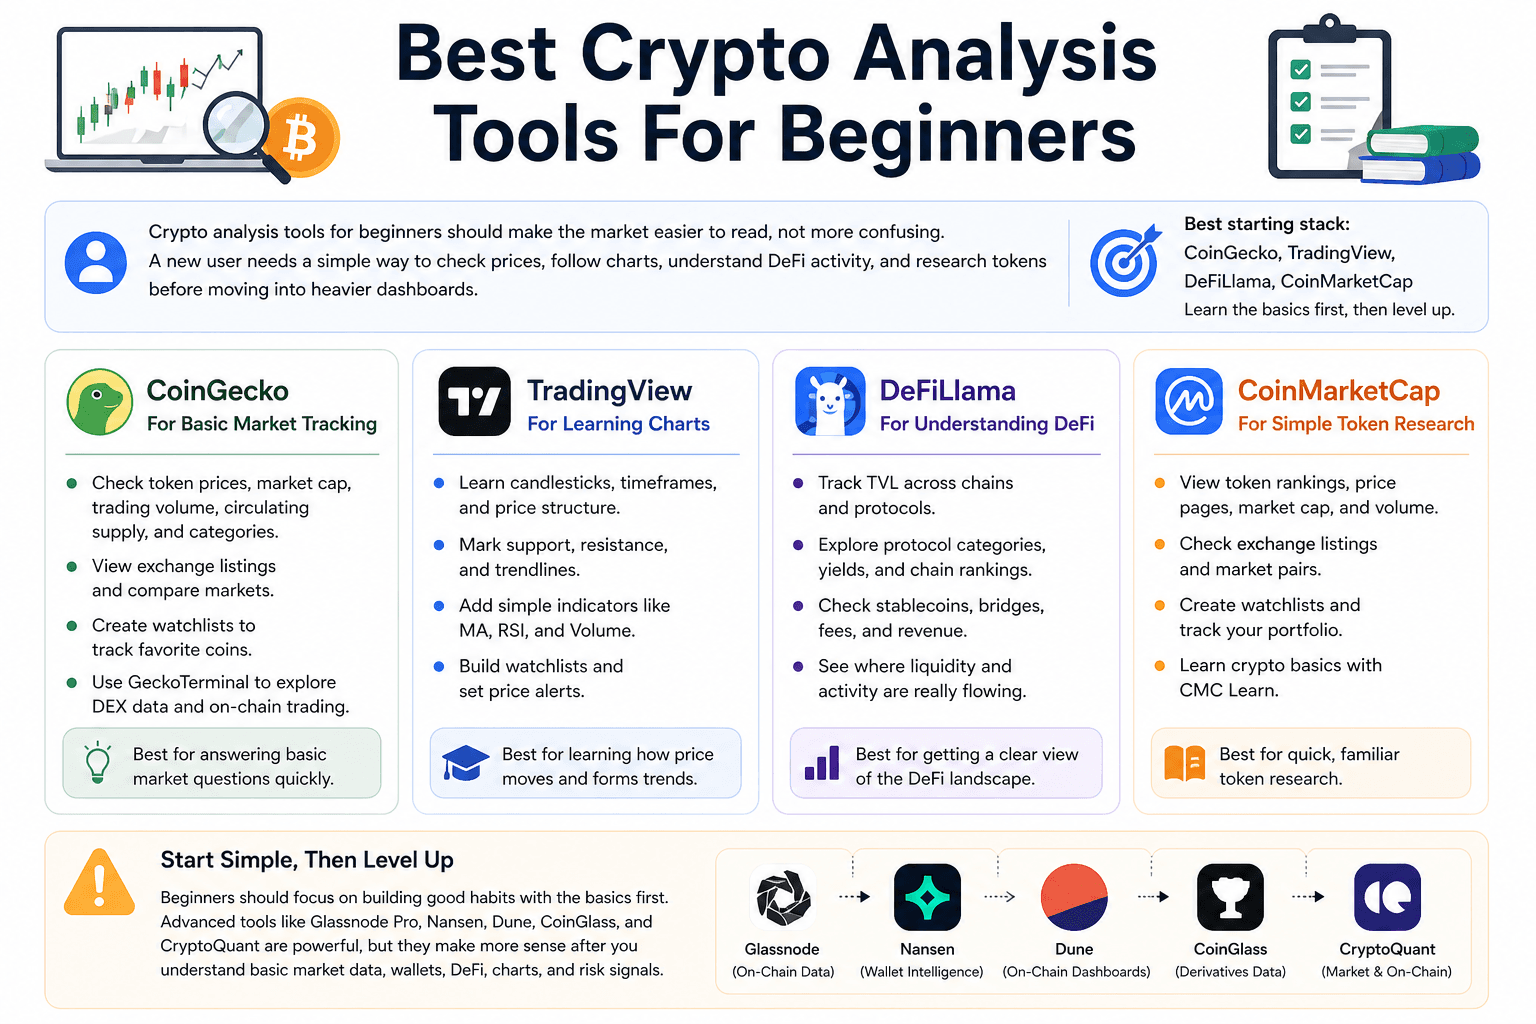
Crypto analysis tools for beginners should make the market easier to read, not more confusing. A new user needs a simple way to check prices, follow charts, understand DeFi activity, and research tokens before moving into heavier dashboards.
The stack for beginners is simple: CoinGecko for market tracking, TradingView for charts, DeFiLlama for DeFi data, and CoinMarketCap for familiar token research. Once those basics are clear, tools like Glassnode, Nansen, Dune, CoinGlass, and CryptoQuant become much easier to use.
 Start Crypto Research Without Paying For Advanced Dashboards
CoinGecko For Basic Market Tracking
CoinGecko is a good first stop because it answers the basic market questions quickly. Users can check token prices, market cap, trading volume, circulating supply, categories, exchange listings, and watchlists without learning a complex analytics interface.
This helps beginners understand whether a token is large or small, actively traded or thinly traded, widely listed or only available on a few venues. GeckoTerminal also gives users a path into DEX data, once they want to study liquidity pools and on-chain token trading.
TradingView For Learning Charts
TradingView helps beginners move from checking price to reading price structure. Users can learn how candlesticks work, mark support and resistance, add simple indicators, build watchlists, and set alerts.
The platform can get advanced quickly, but beginners do not need to start with Pine Script or strategy testing. A clean chart with volume, moving averages, RSI, and basic trendlines is enough at the beginning. The goal is to understand how price behaves before adding too many tools.
DeFiLlama For Understanding DeFi
DeFiLlama gives beginners a clearer view of DeFi without requiring them to inspect every protocol manually. Users can check TVL, chain rankings, protocol categories, yields, stablecoins, bridges, fees, and revenue from one dashboard.
This is useful because DeFi can look scattered at first. DeFiLlama helps users see which chains hold the most liquidity, which protocols dominate a category, where yields are coming from, and whether a project has real usage beyond token hype.
CoinMarketCap For Simple Token Research
CoinMarketCap is useful for beginners who want a familiar market overview. It covers token rankings, price pages, market cap, volume, exchange listings, watchlists, portfolio tracking, and beginner education through CMC Learn.
Its main value is simplicity. A user can search for a token, check basic project data, review market ranking, scan exchange availability, and add it to a watchlist. That makes it a practical research habit before using deeper tools.
Beginners should avoid starting with the most advanced platforms too early. Glassnode Pro, Nansen, Dune SQL dashboards, CoinGlass, and CryptoQuant are powerful, but they make more sense after users understand basic market data, wallets, DeFi, charts, and risk signals.
Best Crypto Tool Stacks By Use Case
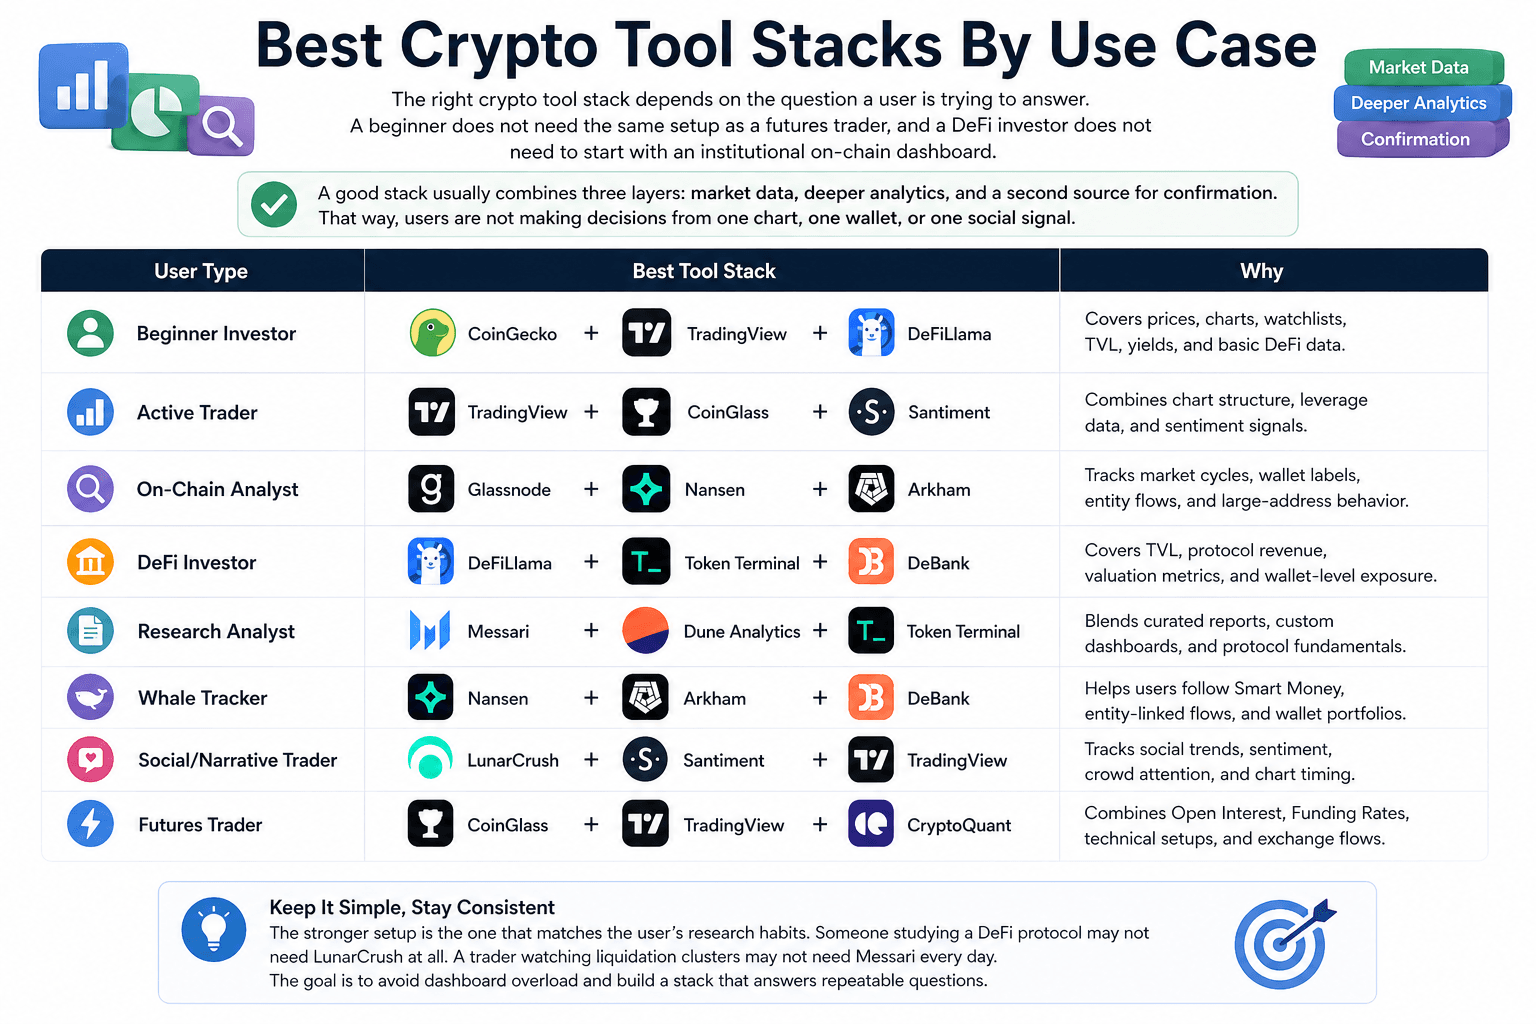
The right crypto tool stack depends on the question a user is trying to answer. A beginner does not need the same setup as a futures trader, and a DeFi investor does not need to start with an institutional on-chain dashboard. A good stack usually combines three layers: market data, deeper analytics, and a second source for confirmation. That way, users are not making decisions from one chart, one wallet, or one social signal.
 Match Your Crypto Tools To Your Research Goal
| User Type | Best Tool Stack | Why |
|---|---|---|
| Beginner Investor | CoinGecko + TradingView + DeFiLlama | Covers prices, charts, watchlists, TVL, yields, and basic DeFi data. |
| Active Trader | TradingView + CoinGlass + Santiment | Combines chart structure, leverage data, and sentiment signals. |
| On-Chain Analyst | Glassnode + Nansen + Arkham | Tracks market cycles, wallet labels, entity flows, and large-address behavior. |
| DeFi Investor | DeFiLlama + Token Terminal + DeBank | Covers TVL, protocol revenue, valuation metrics, and wallet-level exposure. |
| Research Analyst | Messari + Dune Analytics + Token Terminal | Blends curated reports, custom dashboards, and protocol fundamentals. |
| Whale Tracker | Nansen + Arkham + DeBank | Helps users follow Smart Money, entity-linked flows, and wallet portfolios. |
| Social/Narrative Trader | LunarCrush + Santiment + TradingView | Tracks social trends, sentiment, crowd attention, and chart timing. |
| Futures Trader | CoinGlass + TradingView + CryptoQuant | Combines Open Interest, Funding Rates, technical setups, and exchange flows. |
The stronger setup is the one that matches the user’s research habits. Someone studying a DeFi protocol may not need LunarCrush at all. A trader watching liquidation clusters may not need Messari every day. The goal is to avoid dashboard overload and build a stack that answers repeatable questions.
For readers tracking their own holdings across wallets and exchanges, this breakdown of the best crypto portfolio trackers can help them compare portfolio-focused tools more closely.
How To Choose The Right Crypto Analysis Tools
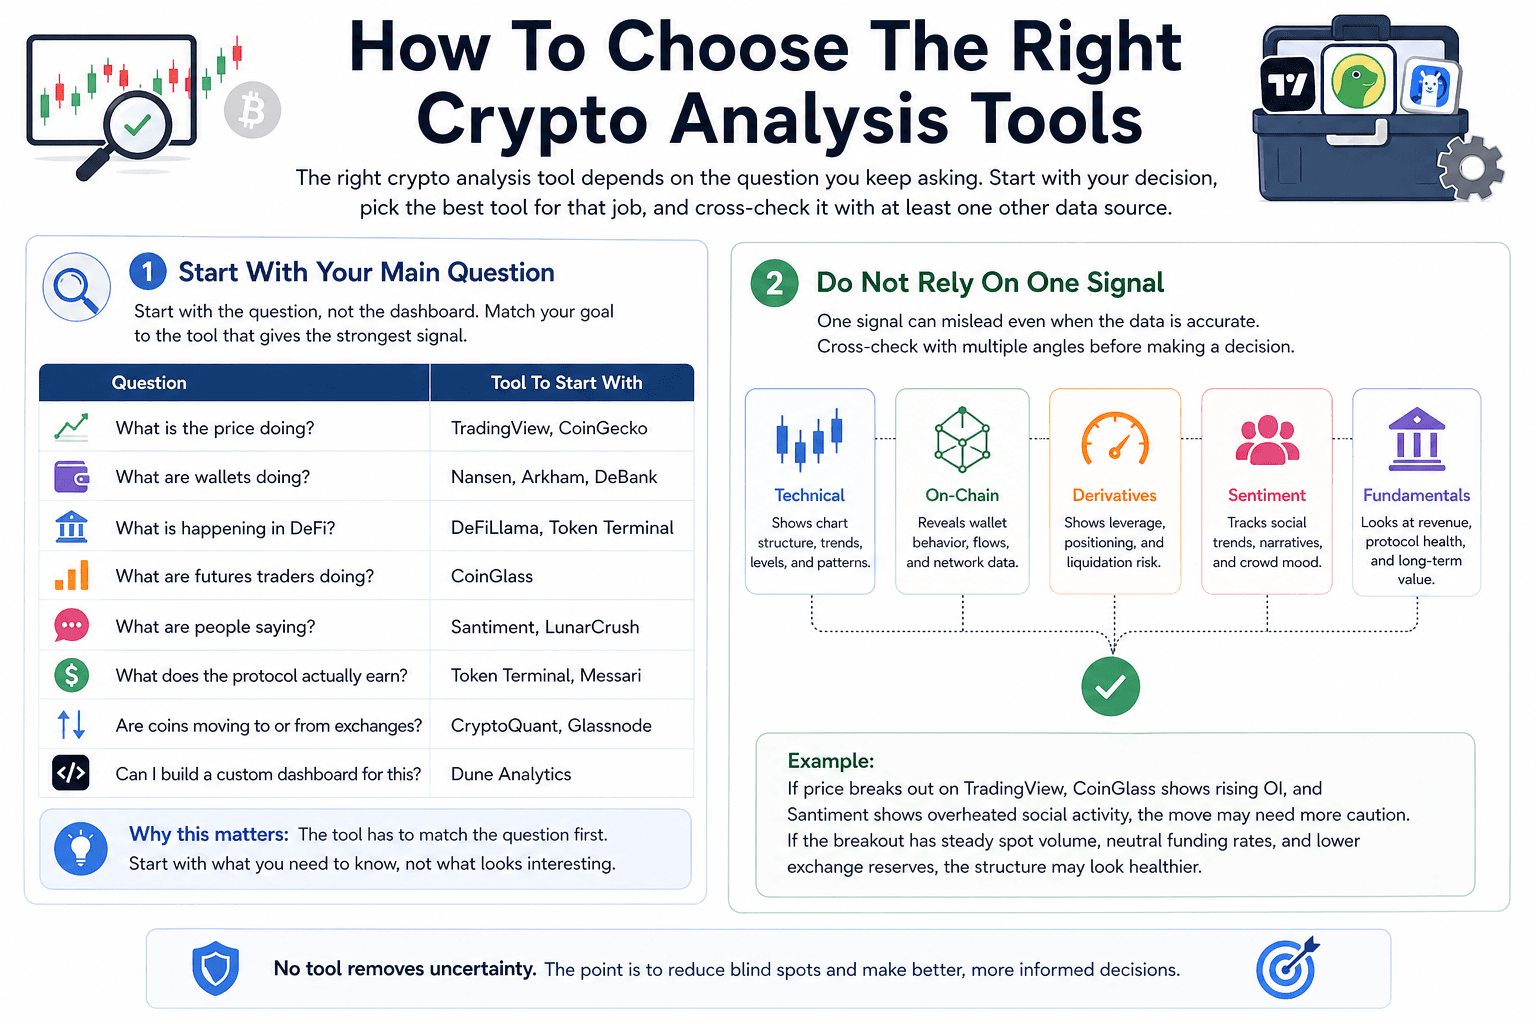
The right crypto analysis tool depends on the question you keep asking. A trader needs a different setup from a DeFi user, and a long-term investor needs a different view from someone tracking whale wallets. A much cleaner approach is to start with the decision you are trying to make, then pick the tool that gives the strongest signal for that decision. After that, cross-check it with at least one other data source.
Beginners who want a clearer starting point can read our crypto trading basics guide before moving into advanced dashboards.
 Pick Tools Based On The Questions You Ask
Start With Your Main Question
Start with the question, not the dashboard. Crypto tools can quickly turn into noise if users open ten tabs before knowing what they want to check.
Here’s a simple way to match the question with the tool:
| Question | Tool To Start With |
|---|---|
| What is the price doing? | TradingView, CoinGecko |
| What are wallets doing? | Nansen, Arkham, DeBank |
| What is happening in DeFi? | DeFiLlama, Token Terminal |
| What are futures traders doing? | CoinGlass |
| What are people saying? | Santiment, LunarCrush |
| What does the protocol actually earn? | Token Terminal, Messari |
| Are coins moving to or from exchanges? | CryptoQuant, Glassnode |
| Can I build a custom dashboard for this? | Dune Analytics |
This keeps the research process tighter. A user checking Bitcoin exchange flows should not begin with social sentiment. A trader studying a breakout should not start with protocol revenue. The tool has to match the question first.
Do Not Rely On One Signal
One signal can mislead even when the data is accurate. Social hype can rise while smart wallets sell. Open Interest can climb during both strong continuation and dangerous overcrowding. Exchange inflows can suggest sell pressure, but they can also reflect internal transfers or liquidity management.
The best crypto research process compares signals from different angles. Technical analysis can show the chart setup. On-chain data can show wallet and exchange behavior. Derivatives data can show leverage. Sentiment data can show whether the crowd is chasing the move.
A simple example: if price breaks out on TradingView, CoinGlass shows rising Open Interest, and Santiment shows overheated social activity, the move may need more caution. If the breakout comes with steady spot volume, neutral Funding Rates, and lower exchange reserves, the structure may look healthier.
No tool removes uncertainty. The point is to reduce blind spots before making a decision.
Free Tools Are Enough For Most Beginners
Most beginners do not need paid crypto analytics on day one. Free tools can already cover the basics: CoinGecko for prices, DeFiLlama for TVL and protocol data, TradingView for charts, Dune for public dashboards, and CoinGlass for Open Interest, Funding Rates, and liquidation snapshots.
Paid tools become useful when the user hits a real limit. That could mean needing wallet labels from Nansen, deeper Bitcoin cycle data from Glassnode, richer exchange-flow metrics from CryptoQuant, or curated protocol research from Messari.
Until then, a simple free stack is usually enough. Learn how to read price, liquidity, wallet activity, DeFi data, and leverage first. Paying for advanced dashboards before understanding the basics usually creates more noise, not better decisions.
Readers comparing wallet-level tools can also check this guide to the best crypto wallets for storage, DeFi access, and portfolio safety.

Final Verdict: Which Crypto Analysis Tool Should You Use?
The best crypto analysis tool depends on the job. CoinGecko is the easiest market-data starting point. Glassnode gives deeper on-chain context. Nansen and Arkham help with wallet and entity tracking. DeFiLlama is the cleanest free DeFi dashboard. TradingView remains the charting layer most traders will use daily
Going category-wise, we can say that:
| Category | Best Tool |
|---|---|
| Best Overall Market Data Tool | CoinGecko |
| Best On-Chain Analytics Tool | Glassnode |
| Best Wallet Tracking Tool | Nansen |
| Best Entity Intelligence Tool | Arkham |
| Best DeFi Analytics Tool | DeFiLlama |
| Best Protocol Fundamentals Tool | Token Terminal |
| Best Research Platform | Messari |
| Best Custom Dashboard Platform | Dune Analytics |
| Best Charting Tool | TradingView |
| Best Derivatives Tool | CoinGlass |
| Best Sentiment Tool | Santiment for behavioral signals, LunarCrush for social momentum |
| Best Portfolio Tracker | DeBank for wallet-level DeFi tracking, Zapper for readable cross-chain activity |
No single platform covers crypto research properly on its own. A good stack usually combines market data, charting, on-chain analytics, sentiment, derivatives, and wallet tracking based on the user’s goal.
For most beginners, CoinGecko, TradingView, DeFiLlama, and CoinGlass are enough to start. For active traders, TradingView and CoinGlass should sit at the center, with Santiment or CryptoQuant added for confirmation. For deeper research, Glassnode, Nansen, Arkham, Messari, Dune, and Token Terminal bring the extra context needed to study wallets, protocols, capital flows, and fundamentals.
The cleanest approach is to build around the question. Use CoinGecko when you need a market snapshot. Use TradingView when the chart needs clarity. Use DeFiLlama when the question is about protocol or chain activity. Use CoinGlass when leverage is driving the move. Use Nansen or Arkham when wallets and entities are the story. That keeps the research practical instead of turning it into dashboard tourism.