M6 Labs Crypto Market Pulse: Navigating The Stormy Crypto Seas
In this article, the author aims to provide readers with a deeper understanding of chart reading and trading strategies in the cryptocurrency market. They acknowledge that reading charts is just one skill among many that a crypto trader needs, and emphasize the importance of combining chart reading with a good understanding of the macroeconomic climate and onchain analysis for more accurate predictions.
The author asserts that trading in the cryptocurrency market is not a game and highlights the need to develop a trading system that allows traders to survive and consistently make profits, rather than relying on gambling. They emphasize the importance of understanding the market as a battlefield, where the weak are crushed and only the strong prevail.
The concept of confluence and aggregation is introduced as a way to enhance the decision-making process in trading. Confluence is described as the merging of diverse perspectives and tools to craft a robust trading approach, similar to blending flavors and textures in a gourmet meal. The author suggests that using a variety of indicators and strategies adds depth and insight to trading analysis and allows traders to tap into collective wisdom for well-informed decisions.
The article then delves into the explanation and usage of several commonly used indicators in trading, such as Moving Average (MA), Exponential Moving Average (EMA), Moving Average Convergence Divergence (MACD), Ichimoku Cloud, Bollinger Bands, and Fibonacci Retracement. Each indicator is briefly defined, and their functions and uses in identifying trends, support and resistance levels, and potential buy or sell opportunities are explained.
Furthermore, the author discusses the importance of onchain analysis in navigating the unique challenges and opportunities of the cryptocurrency market. They highlight Glassnode, a leading crypto analytics firm that provides valuable insights into market movements. The article provides an overview of some key indicators available through Glassnode, such as Philip Swift's Pi Cycle Top indicator and the Mayer Multiple, which help traders gauge market extremes and potential reversal points.
To illustrate the concepts discussed, the article analyzes the performance of several recent airdrop tokens, including AEVO, DYM, JUP, and ETHFI. The analysis involves using indicators like SMA, MACD, Bollinger Bands, and Ichimoku Cloud to identify trends, support and resistance levels, and potential market shifts.

The article concludes by suggesting practicing risk management and considering the collective signals from multiple indicators when making trading decisions. Readers are encouraged to continue learning and exploring the topics discussed in the article.
Overall, the article provides a comprehensive overview of chart reading, trading strategies, and the importance of confluence and aggregation in the cryptocurrency market. It offers practical examples and insights to help traders navigate the market with confidence and mitigate risks.
In this article, the author aims to provide readers with a deeper understanding of chart reading and trading strategies in the cryptocurrency market. They acknowledge that reading charts is just one skill among many that a crypto trader needs, and emphasize the importance of combining chart reading with a good understanding of the macroeconomic climate and onchain analysis for more accurate predictions.
The author asserts that trading in the cryptocurrency market is not a game and highlights the need to develop a trading system that allows traders to survive and consistently make profits, rather than relying on gambling. They emphasize the importance of understanding the market as a battlefield, where the weak are crushed and only the strong prevail.
The concept of confluence and aggregation is introduced as a way to enhance the decision-making process in trading. Confluence is described as the merging of diverse perspectives and tools to craft a robust trading approach, similar to blending flavors and textures in a gourmet meal. The author suggests that using a variety of indicators and strategies adds depth and insight to trading analysis and allows traders to tap into collective wisdom for well-informed decisions.
The article then delves into the explanation and usage of several commonly used indicators in trading, such as Moving Average (MA), Exponential Moving Average (EMA), Moving Average Convergence Divergence (MACD), Ichimoku Cloud, Bollinger Bands, and Fibonacci Retracement. Each indicator is briefly defined, and their functions and uses in identifying trends, support and resistance levels, and potential buy or sell opportunities are explained.
Furthermore, the author discusses the importance of onchain analysis in navigating the unique challenges and opportunities of the cryptocurrency market. They highlight Glassnode, a leading crypto analytics firm that provides valuable insights into market movements. The article provides an overview of some key indicators available through Glassnode, such as Philip Swift's Pi Cycle Top indicator and the Mayer Multiple, which help traders gauge market extremes and potential reversal points.
To illustrate the concepts discussed, the article analyzes the performance of several recent airdrop tokens, including AEVO, DYM, JUP, and ETHFI. The analysis involves using indicators like SMA, MACD, Bollinger Bands, and Ichimoku Cloud to identify trends, support and resistance levels, and potential market shifts.
The article concludes by suggesting practicing risk management and considering the collective signals from multiple indicators when making trading decisions. Readers are encouraged to continue learning and exploring the topics discussed in the article.
Overall, the article provides a comprehensive overview of chart reading, trading strategies, and the importance of confluence and aggregation in the cryptocurrency market. It offers practical examples and insights to help traders navigate the market with confidence and mitigate risks.
GM, Anon! Last time, we left you with a beginner’s roadmap to start your journey reading charts.
Today, we’re going to dive a little deeper into more complex topics to arm you with the information you need to navigate the stormy seas of trading.
Let’s get a few things out of the way before we begin.
The skill of reading charts is one of many that a crypto trader needs. For example, chart reading combined with a good understanding of the current macroeconomic climate allows you to stack the probabilities in your favor. Stacking good TA with on-chain analysis and an understanding of the macroeconomic climate is even better!
You see where we’re going with this. This isn’t an overnight thing.
At the end of the day, the markets are a game of probabilities, and your goal should be to develop a system that is not 100% percent right because not even the best traders on this planet are always right, but to rather develop a system that lets you survive and have a success rate that keeps you in profit.
Understand this, which is lost on most tourists who occasionally dabble in crypto and other asset classes.
When you enter the trading game, you are entering the equivalent of a modern medieval battlefield, where the weak are crushed and the strong prevail.
THE MARKET IS THE PERFECT KILLING MACHINE.
This is not a game.
Gambling and developing a system that delivers profits time and time again are two very different things.
We take it that if you’re reading this letter you want to embark on a journey that results in you being able to extract value from the markets for years to come while effectively mitigating risk and seeing your portfolio steadily grow.
Now we don’t have anything against the degens who gamble, in fact, we dabble in a little gambling ourselves, but we need to mentally separate these activities as they are unrelated.
Real trading and investing are very different from gambling.
Without further delay let’s get into what you came here for.
Today, we'll delve into:
- Confluence
- Intro to indicators
- Bottom signals and blow-off tops
- Real-world examples and analysis
Building Your Strategy
The Strength of Confluence and Aggregation
Confluence and aggregation are like partners in the world of trading, working together to enhance your decision-making process.
Confluence isn't merely about merging strategies; it's about amalgamating diverse perspectives and tools to craft a robust trading approach. Think of it as concocting a gourmet meal – you wouldn't rely on a single ingredient; instead, you'd blend flavors and textures to achieve culinary perfection.
Similarly, in trading, utilizing a blend of indicators and strategies adds layers of insight and depth to your analysis. It's akin to having a well-stocked toolkit with different tools for different tasks – each indicator brings its own unique strengths and perspectives to the table.
By harnessing the power of confluence and information aggregation, traders can navigate the markets with heightened confidence and precision, tapping into the collective wisdom of multiple sources to make well-informed decisions.
So, the next time you're dissecting a chart, keep an eye out for confluence – it's the secret ingredient that elevates your trading prowess to new heights!
Now, let’s delve into some commonly used indicators to get you going.
Indicators
Now, many of you have likely encountered the terms below frequently in trading discussions and articles.
Let's provide you with simple definitions for each, along with a brief explanation of how they function. When seeking confluence through these indicators, consider this: if eight out of ten indicators indicate a positive trend while two are negative, it's reasonable to assume a bullish trend.
This illustrates a simple method of aggregating these tools. Understanding the time horizons and the types of market moves each indicator is adept at capturing is crucial. To practice this, pull up a chart on the daily timeframe and observe how each indicator reacts to significant events in the crypto market, such as last year's USDC FUD or the Terra Luna collapse.
Analyze past bull and bear events using these indicators, adjust their settings and timeframe—try switching to the 3-day or weekly chart—and observe how quickly the indicators respond to events. These are fundamental guidelines to help you get started and practice with these tools, but remember: never rely solely on one indicator!
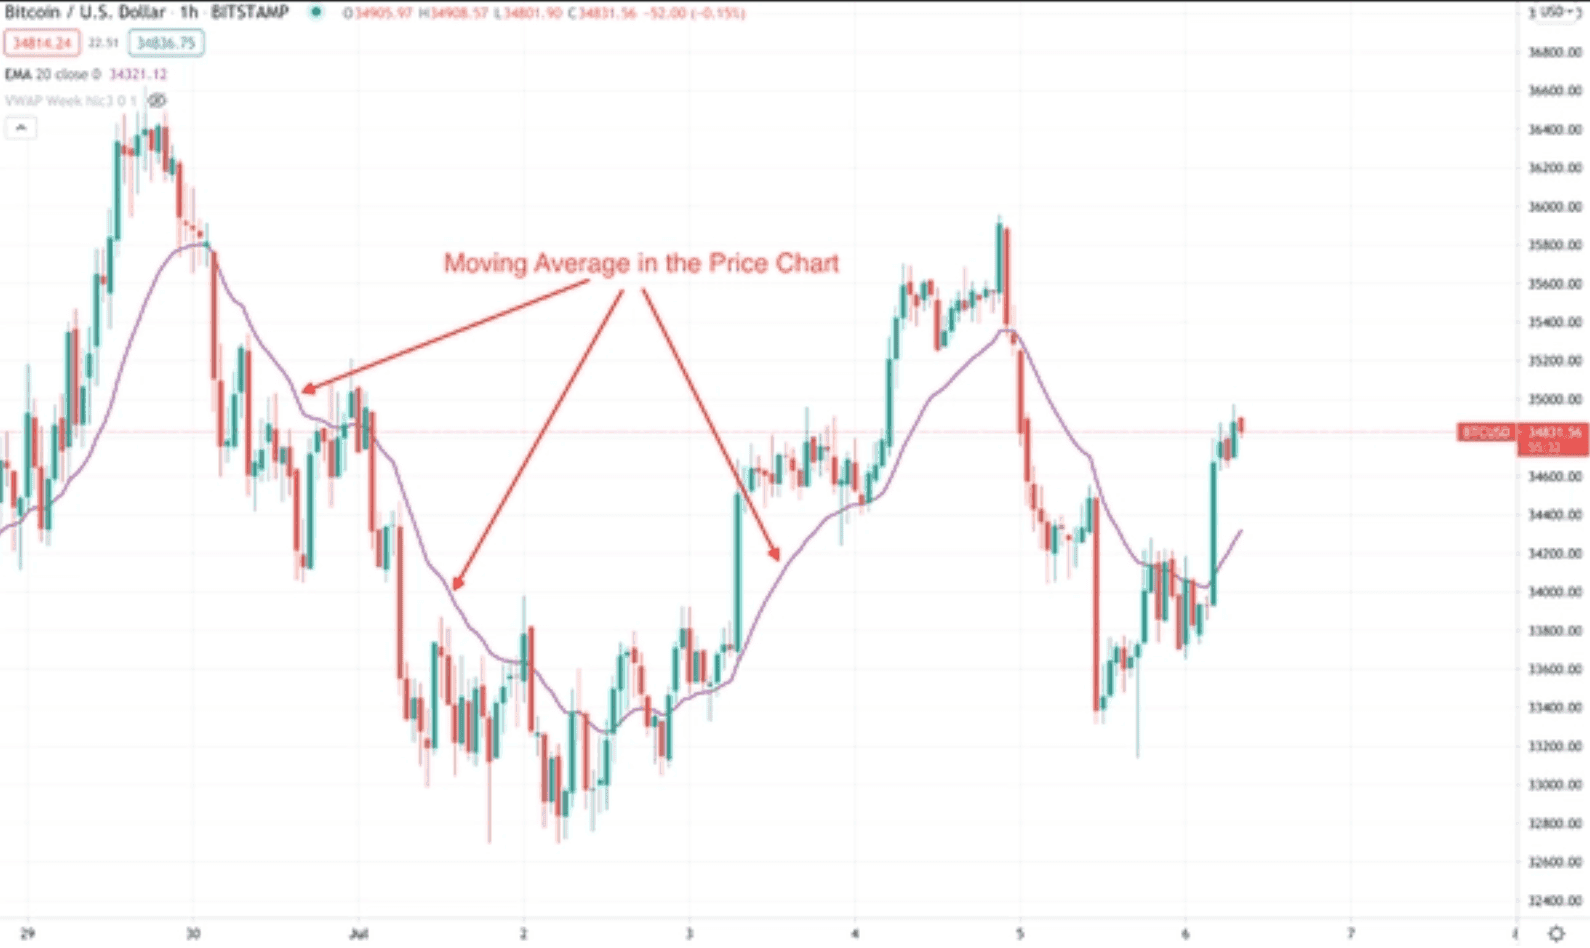
Moving Average (MA)
This indicator smooths out price data over a specified period, providing a clear trend direction. Traders commonly use the MA to identify support and resistance levels and potential trend reversals.
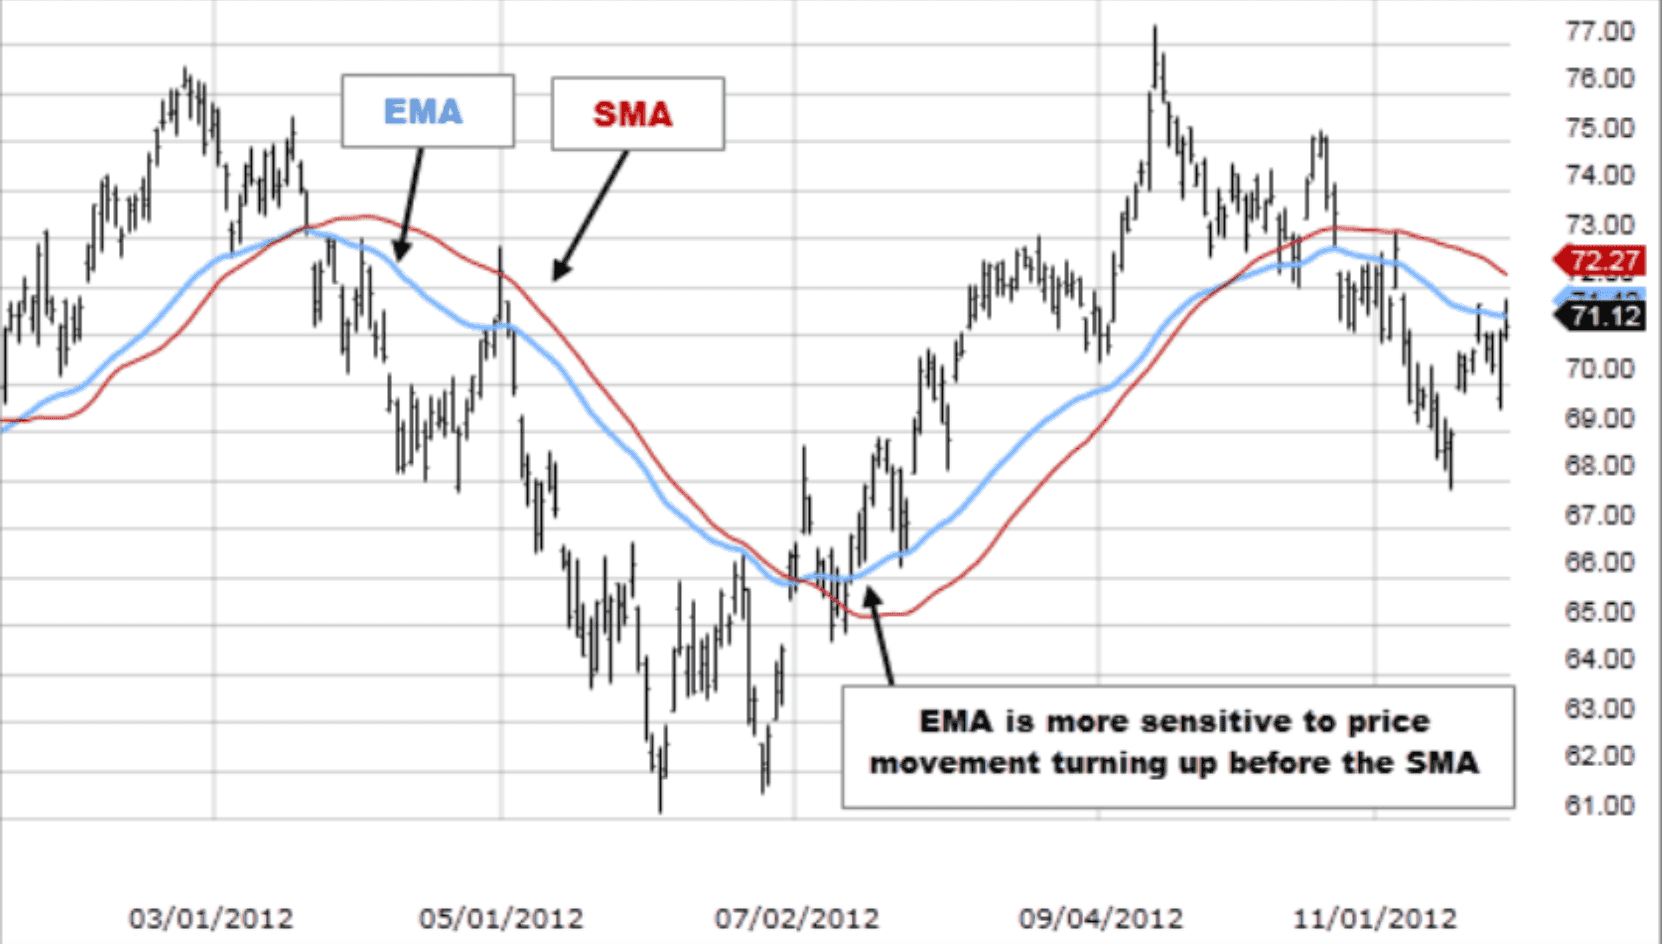
Exponential Moving Average (EMA)
Similar to the MA, the EMA places more weight on recent prices, making it more responsive to price changes. It helps traders identify short-term trends and confirm trend reversals.
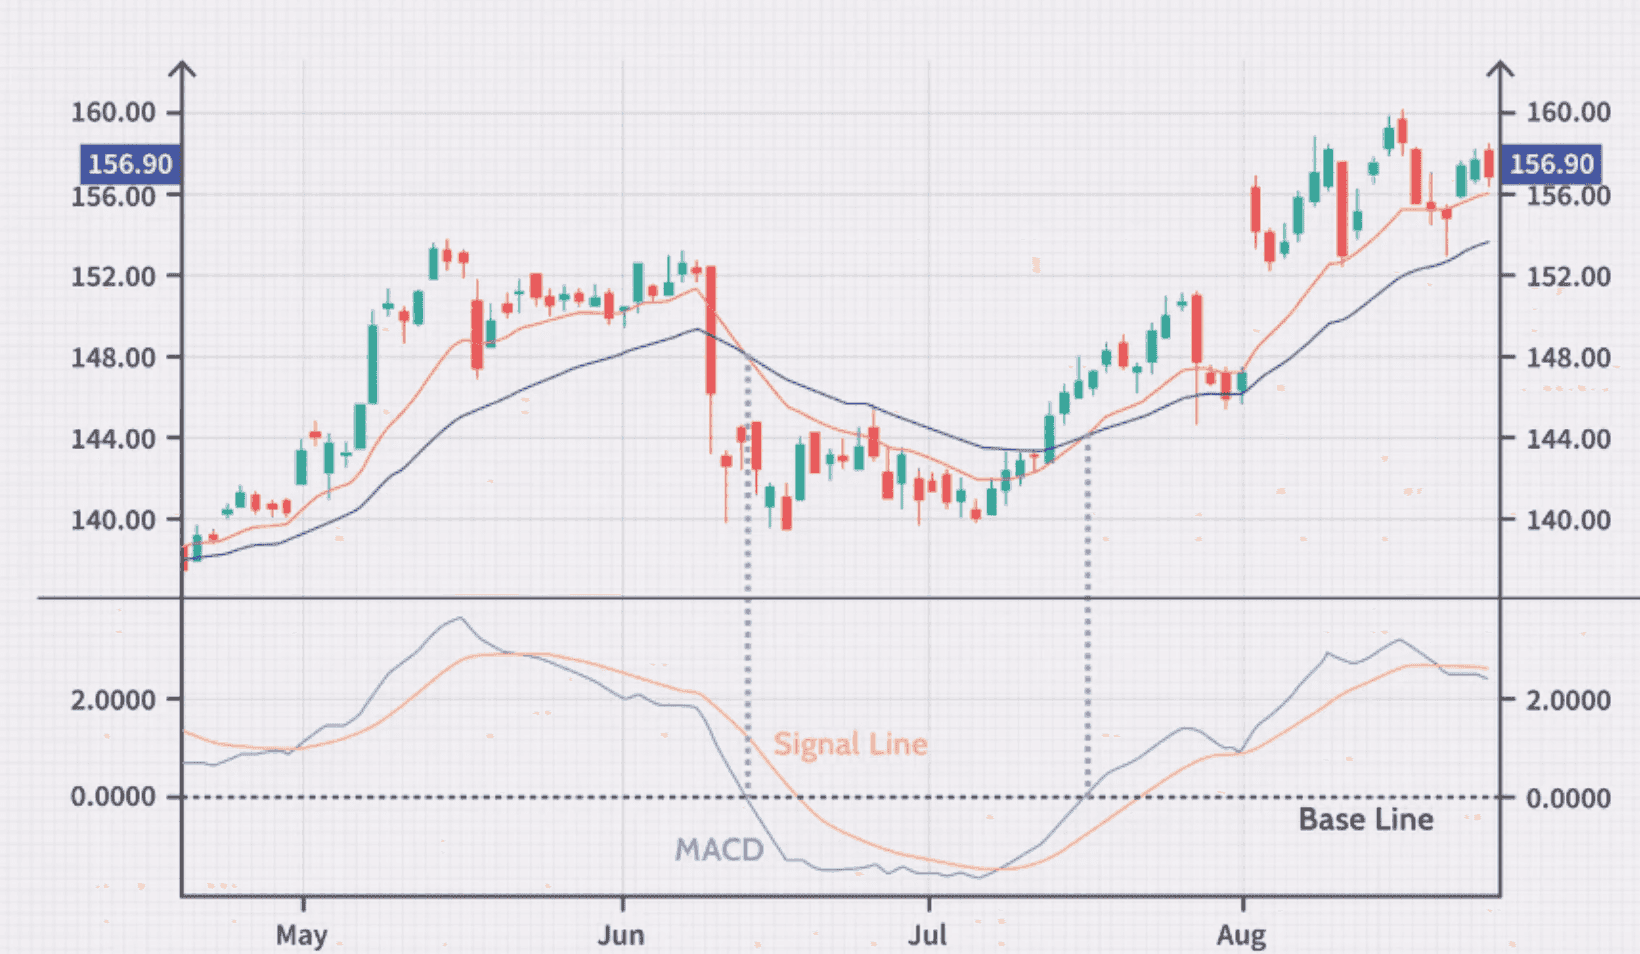
Moving Average Convergence Divergence (MACD)
MACD compares two moving averages to identify changes in momentum. Convergence and divergence between these moving averages signal potential buy or sell opportunities. Traders also use MACD to identify bullish or bearish trends.
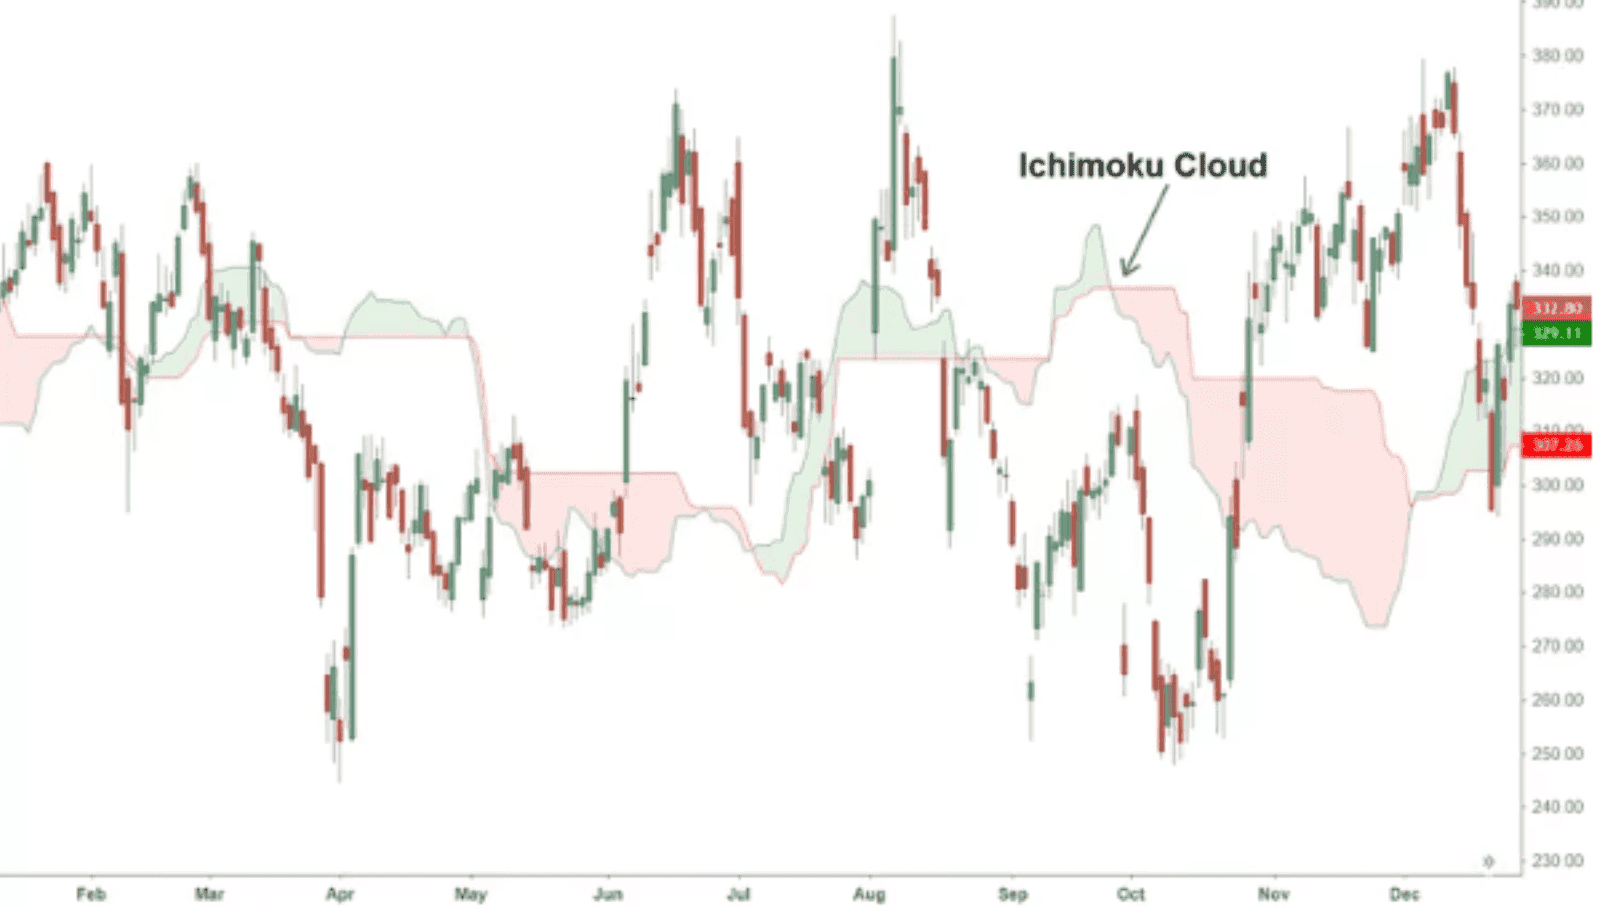
Ichimoku Cloud
The Ichimoku Cloud is a comprehensive indicator that provides information on support and resistance levels, trend direction, and momentum. Traders use it to identify potential trend reversals or to confirm the strength of a trend.
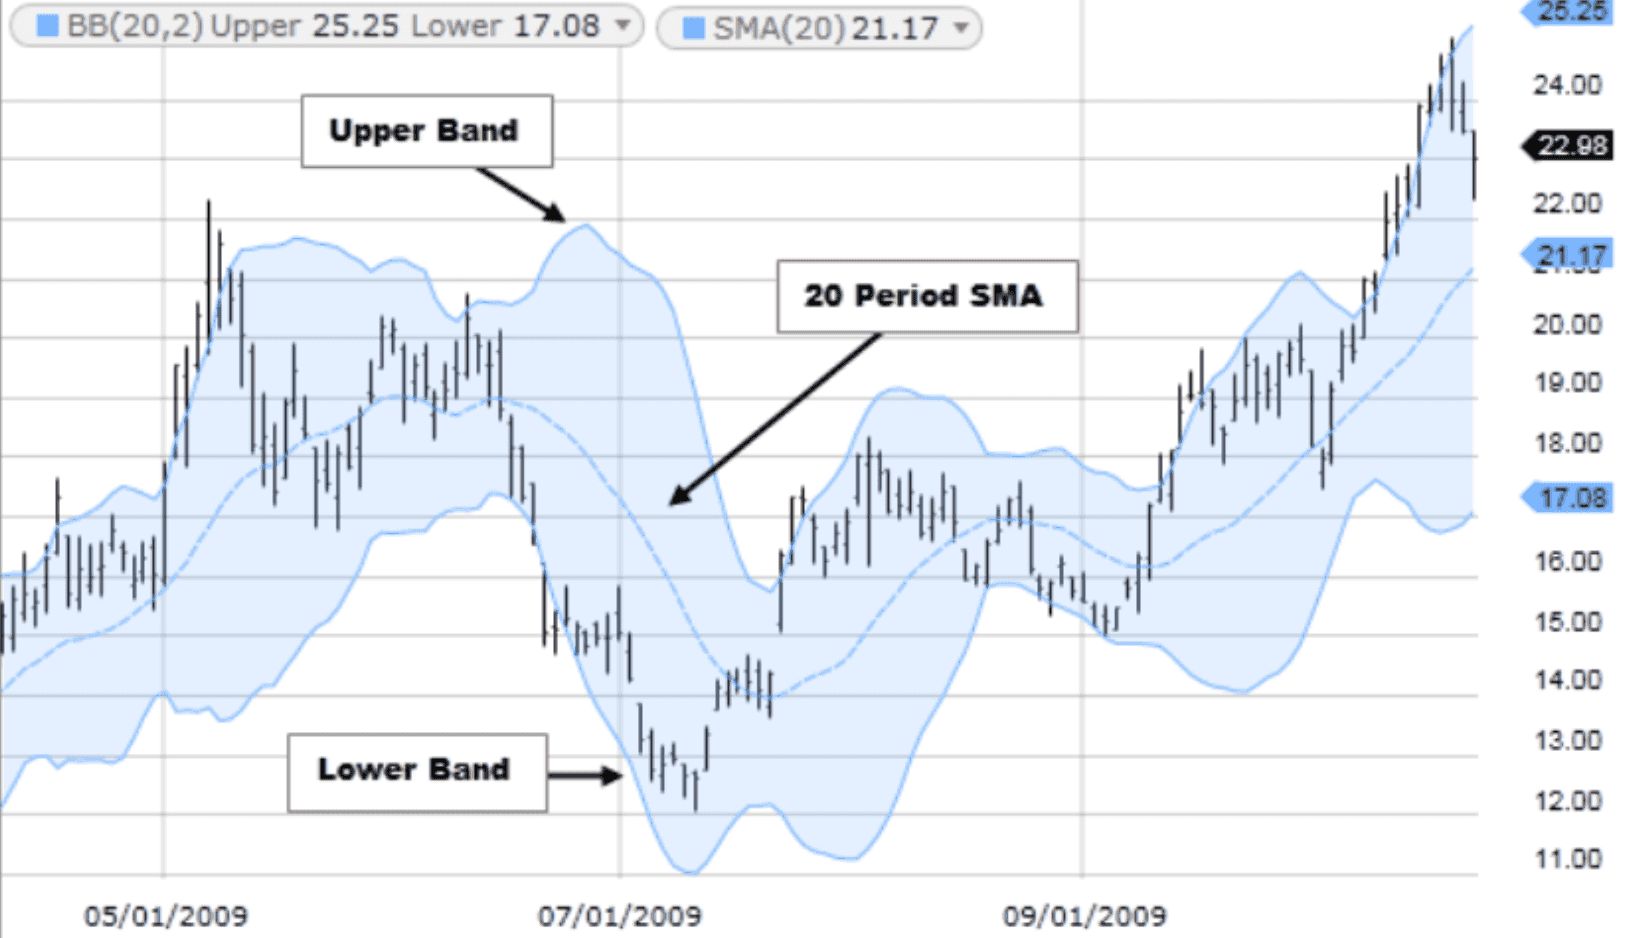
Bollinger Bands
Bollinger Bands consist of a moving average and two bands plotted above and below it. These bands expand and contract based on volatility levels. Traders use Bollinger Bands to identify overbought or oversold conditions and potential price breakouts.
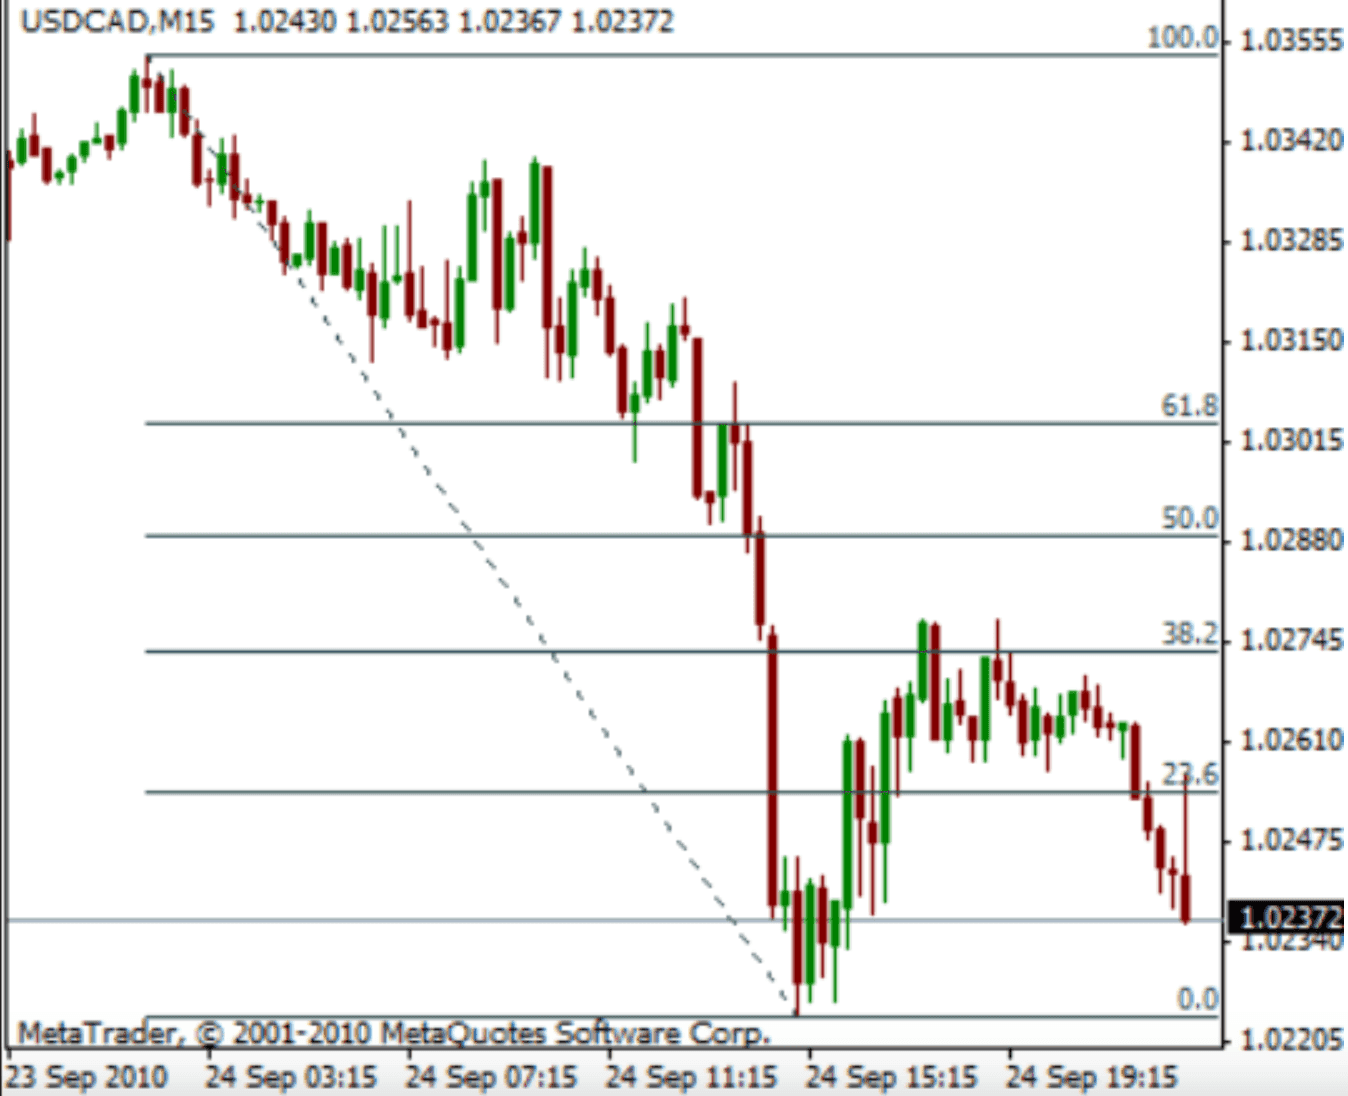
Fibonacci Retracement
Fibonacci retracement identifies potential support and resistance levels based on key Fibonacci ratios. Traders use retracement levels to anticipate potential price reversals or to set profit targets. The Fibonacci retracement tool helps traders identify significant levels where price may react, providing insights into potential entry and exit points.
Navigating the Highs and Lows of Crypto Markets
Determining market tops and bottoms in the crypto world requires a nuanced approach, considering the unique mechanics of digital assets compared to traditional markets.
While the volatility of crypto markets presents challenges, it also offers opportunities, especially with the availability of advanced analytical tools like on-chain analysis.
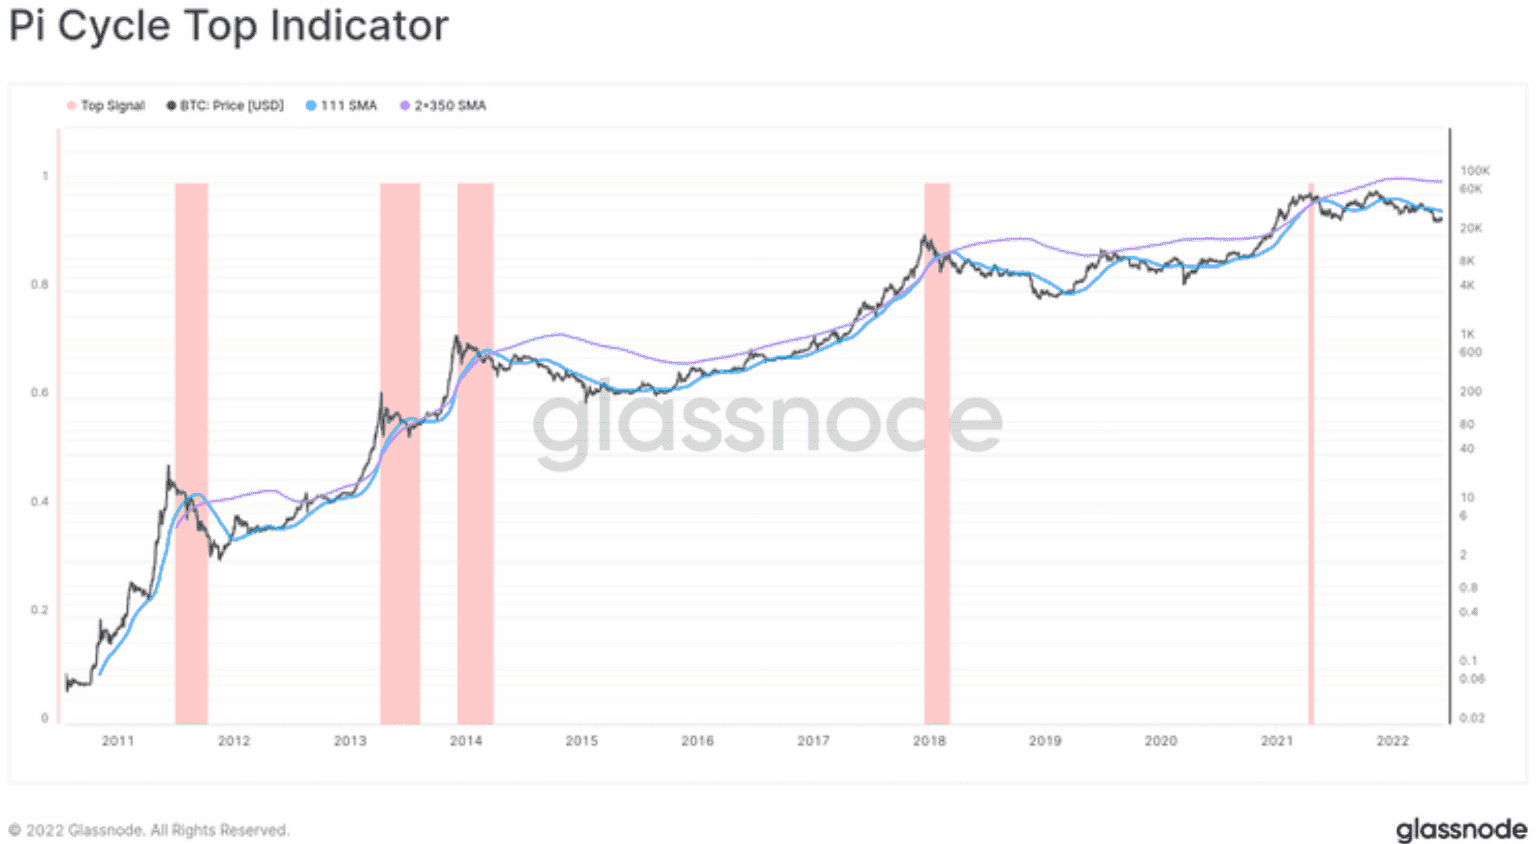
Glassnode, a leading crypto analytics firm, provides valuable insights into market movements, complementing traditional trading strategies. By integrating on-chain analysis with your trading approach, you can effectively identify significant market shifts, such as bottoms and tops. Check out Glassnode here.
Here's a breakdown of some key indicators to consider.
Philip Swift's Pi Cycle Top indicator compares the momentum of two moving averages to detect overheated or cooling-off markets. It offers signals based on the crossover of short and long-term momentum references.
The Mayer Multiple, an oscillator, measures the distance between price and the 200-day moving average, indicating overbought and oversold conditions. It helps traders gauge market extremes and potential reversal points.
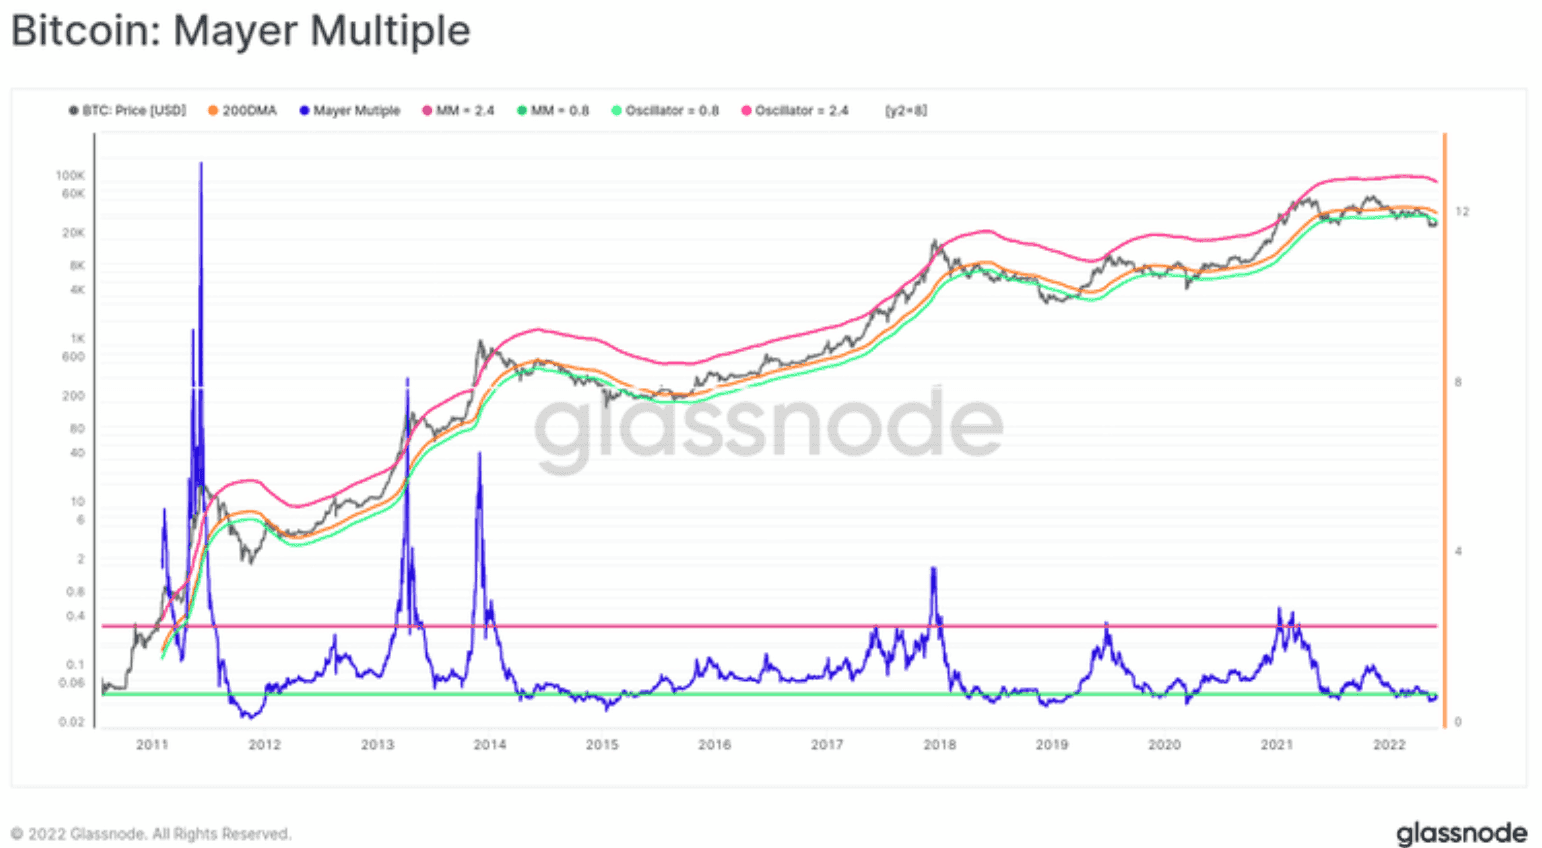
With Glassnode's Advanced plan, traders can access a range of sophisticated metrics, including MVRV Z-Score, Entity-Adjusted Dormancy Flow, Reserve Risk, and Realized HODL Ratio. These metrics offer deeper insights into investor sentiment, coin spending patterns, and market strength.
By combining these indicators and leveraging on-chain analysis, traders can navigate crypto markets with confidence. Remember to consider the collective signals from multiple indicators and practice risk management to make informed trading decisions.
Technical Analysis – Let’s Analyze Some Airdrops
Today, we are going to analyze some recent airdrop tokens. Let’s see how they have been performing after their airdrops.
- Aevo (AEVO)
- Dymension (DYM)
- Jupiter (JUP)
- Ether fi (ETHFI)
#1 AEVO
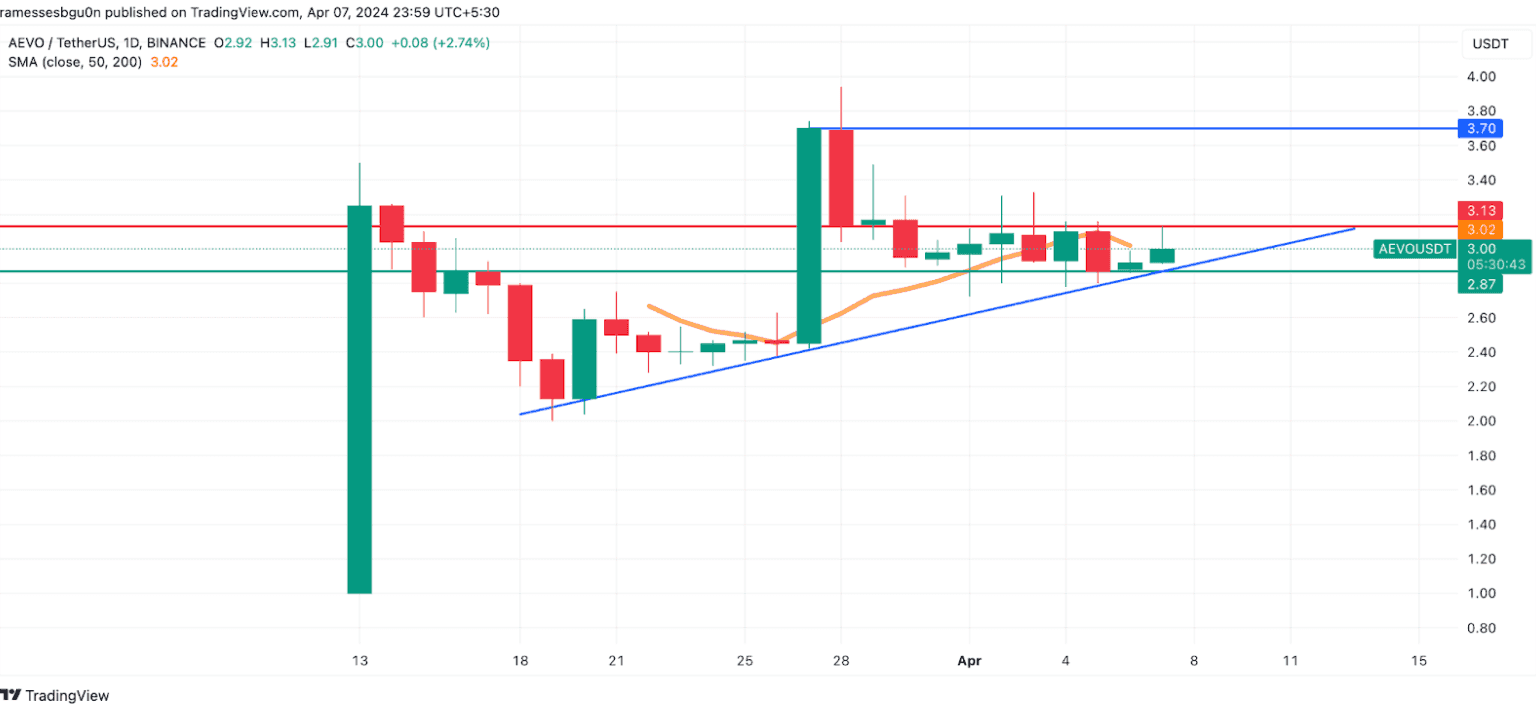
First, let’s check the daily chart since it is a relatively new coin. With the daily chart, we can do some basic analysis. First, as you can see, the price is trending horizontally in a tight range between $3.13 and $2.87. We will be using a 10-day SMA here. As you can see, this indicator has repeatedly acted as a resistance to the price. AEVO must overcome this SMA to break past the $3.13 resistance.
To better understand the picture, let’s look at the 4-hour AEVO/USDT chart.
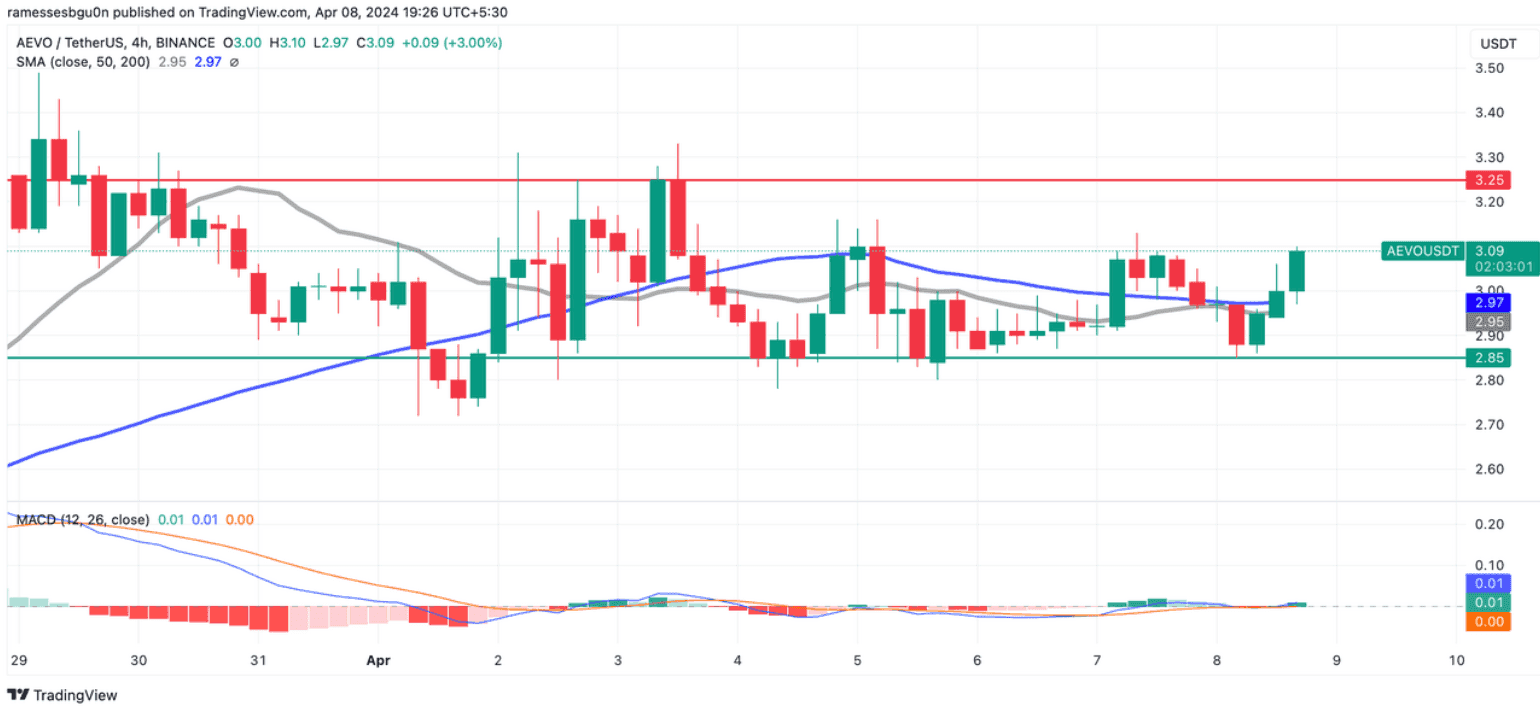
Ok, so we have a lot more candles to work with.
Let's try out one of the indicators we discussed above – MACD
The MACD indicates a shift in market momentum from bearish to bullish, suggesting that buyers are now in control. This shift is clearly evident, as evidenced by three consecutive green candles that have turned the 20-unit and 50-unit SMAs from resistance into support.
The buyers will now aim to take down resistance at $3.25.
#2 DYM
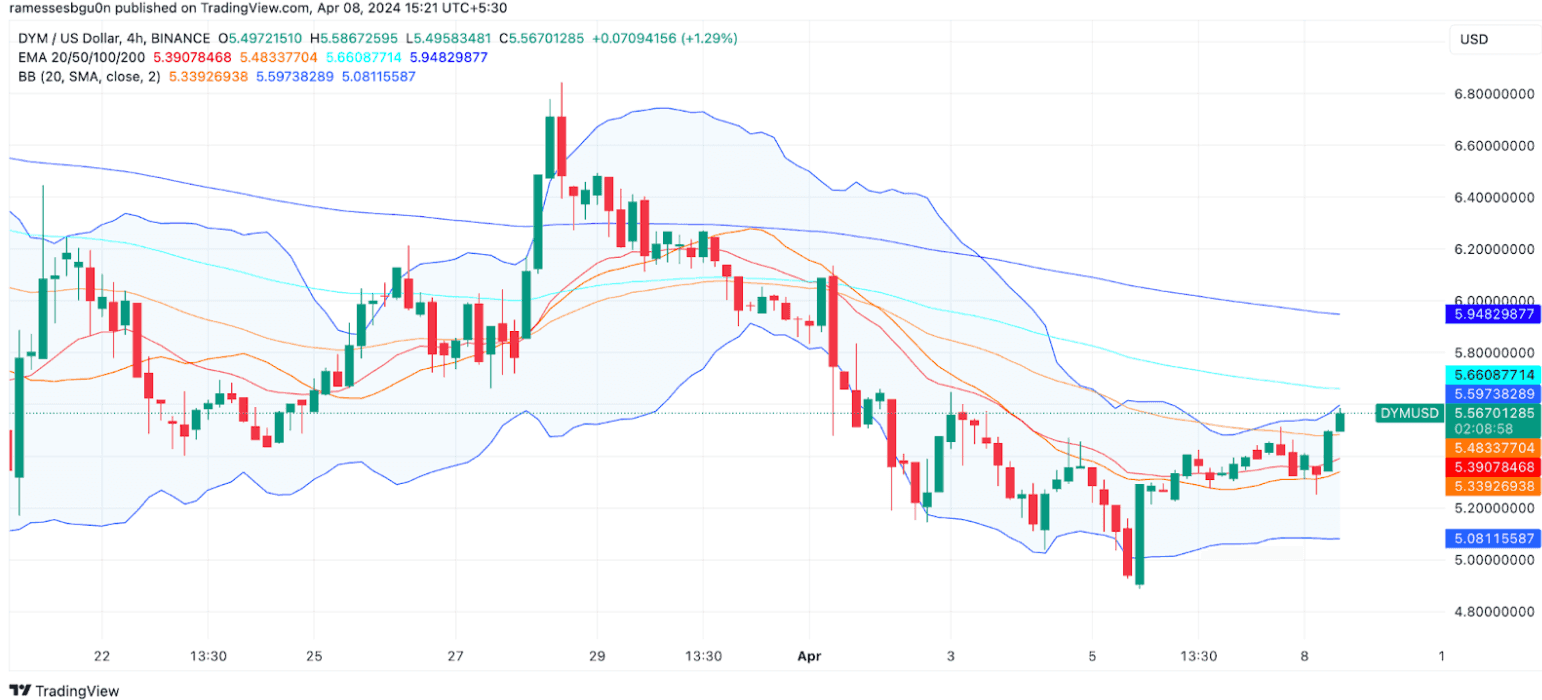
Let’s analyze the 4-hour DYM/USDT price chart. We will be using the 20-unit Bollinger Band and EMA indicators. We will be using EMA indicators similar to how we used our SMA indicators.
During the second last session in our 4-hour chart, the price jumped from $5.33 and $5.50. In the process, the buyers managed to flip the crucial 20-unit and 50-unit EMAs from resistance to support.
However, the buyers seem to have encountered resistance at the upper band of the Bollinger Band. The bands are expanding, indicating higher price volatility. If the buyers take advantage of this volatility, the price will meet next resistance at 100-unit EMA.
#3 JUP
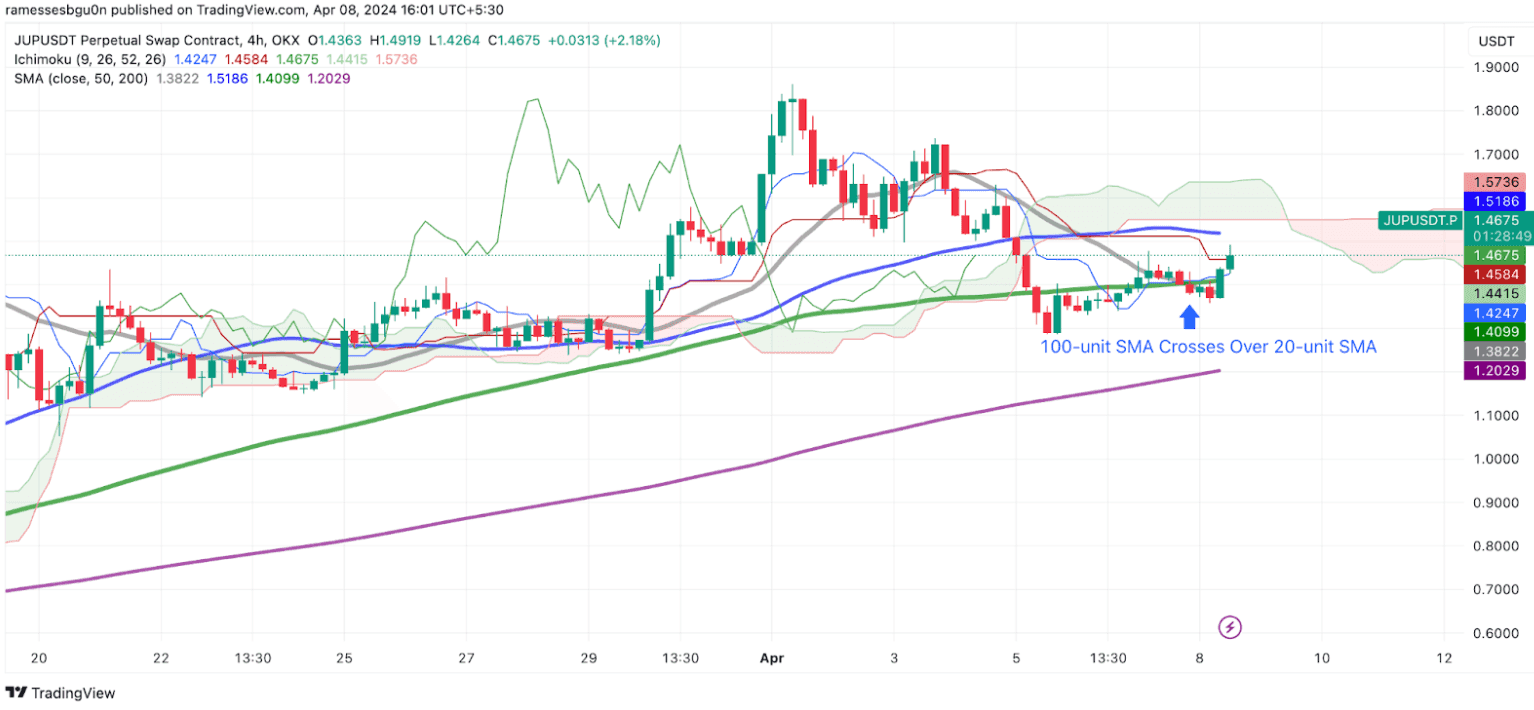
The 4-hour JUP chart will allow us to analyze crosses and the Ichimoku cloud. We have explained how the latter works, but what about crosses?
A "cross" occurs when two moving average lines intersect. If a longer-term SMA crosses above a shorter-term SMA, it indicates a bearish cross, and vice versa.
There are a couple of things to note in this chart:
- The 100-unit SMA has crossed over the 20-unit SMA, charting a bearish cross.
- The Ichimoku cloud has flipped from green to red.
Both indicators show that JUP is about to face a bearish correction in the 4-hour chart. So, if you are holding JUP, be a little mindful.
#4 ETHFI
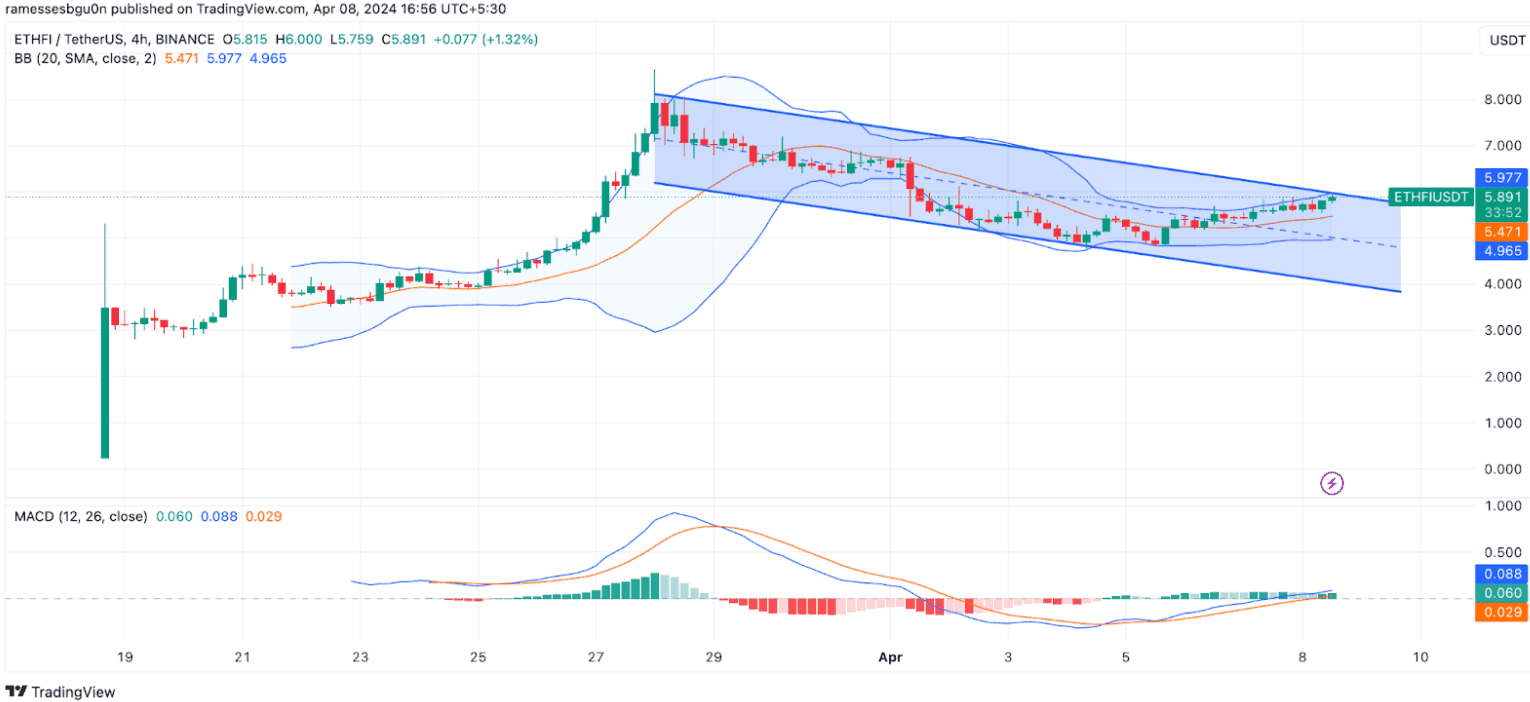
We will also check the 4-hour chart for ETHFI. ETHFI is priced at $5.75-$5.80 and is currently pressed between the upper Bollinger band and the 20-unit SMA (the mid-Bollinger Band). You can also see that the price has been trending downward, indicating that the bears took control after ETHFI touched $8.
However, there are two positive indicators:
- The MACD indicator shows bullish market momentum.
- The Bollinger Bands are expanding, indicating increasing price volatility.
If the buyers take advantage of this and break above the Bollinger Band, ETHFI should reach $6.50.
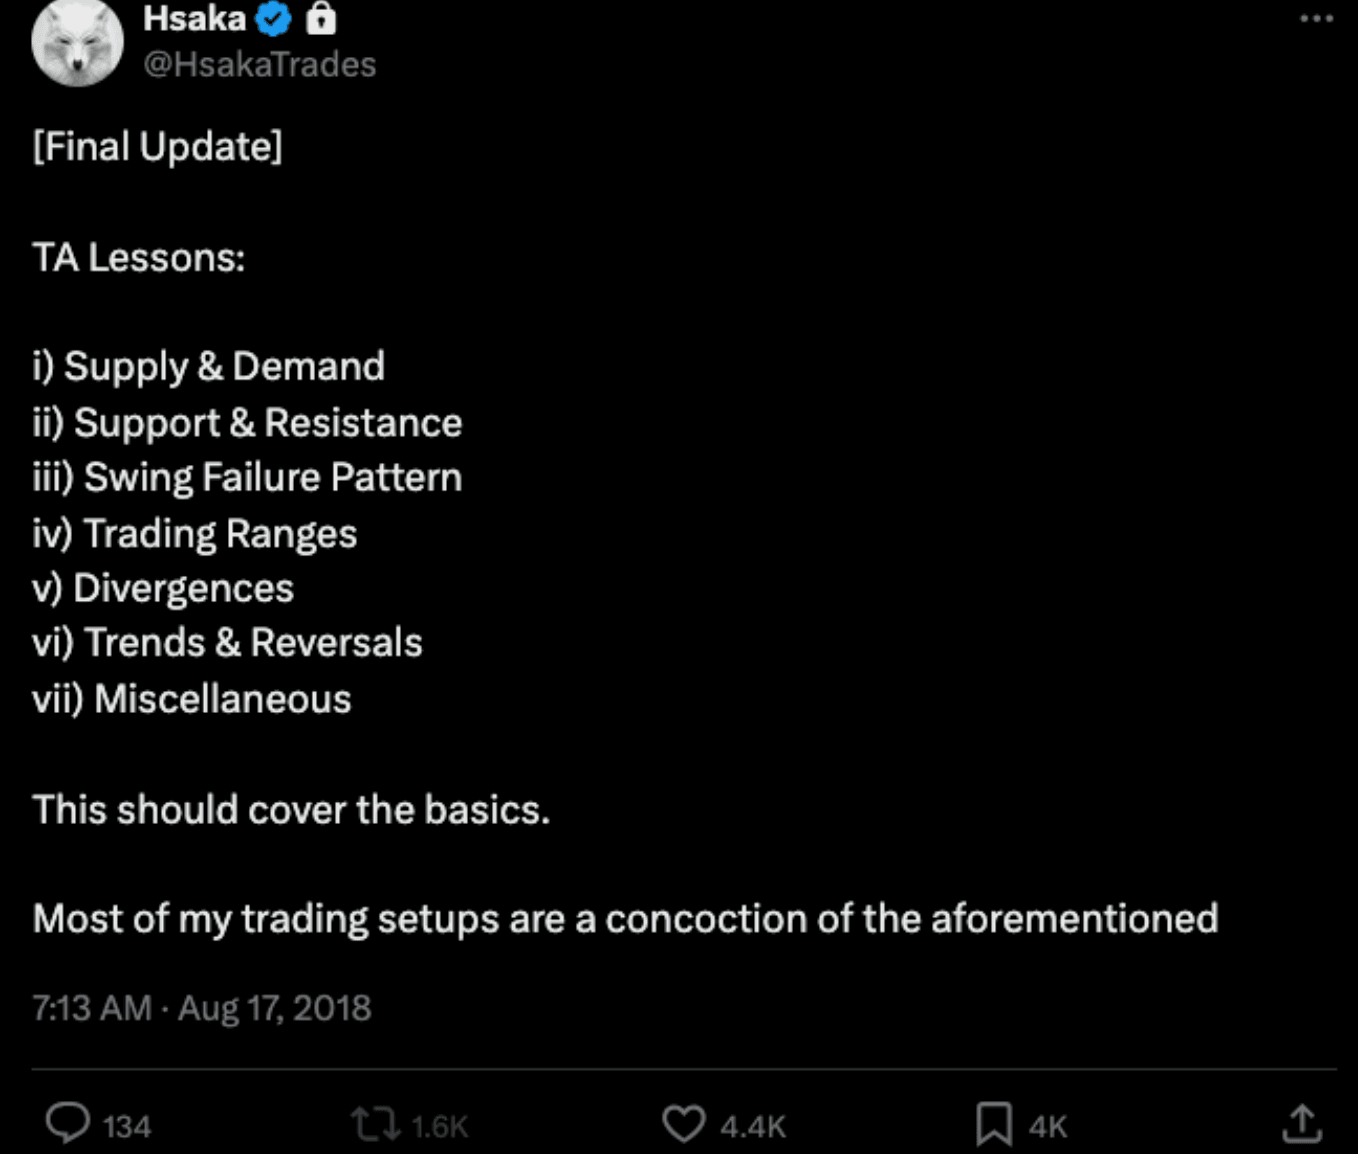
Before we finish off for today, be sure to check out this thread by Hsaka summarising many of the topics we’ve been discussing.
That's it for this week Anon! See you next week!
Enjoyed this article?
- Subscribe to Crypto Pragmatist by M6 Labs newsletter for crypto-native industry insights and research read by 30k+ subscribers
- Follow us on Twitter for Tweets providing top-notch insights and bridging the gap between users, builders, and leaders in the crypto space

Disclaimer: These are the writer’s opinions and should not be considered investment advice. Readers should do their own research.