M6 Labs Crypto Market Pulse: Reading The Crypto Star Charts
The article provides an in-depth exploration of chart analysis in the crypto market. It acknowledges that charts can be overwhelming for newcomers but aims to provide the tools to understand and interpret them. The article starts by emphasizing the need to view charts objectively, without being influenced by emotions triggered by the colors of candlesticks.
The article then explains the nature of markets as convergence points for buyers and sellers and introduces the concept of time value of money, highlighting the challenges of short-term trading compared to longer-term investments. It further explores concepts like the Dow Theory, which focuses on market trends and trend reversals, as well as support and resistance levels.
The Wyckoff Method is also discussed, which involves identifying market trends and potential price movements based on supply and demand dynamics, particularly in the phases of accumulation and distribution.
The article then delves into candlestick reading, explaining that bullish candles indicate buying pressure, while bearish candles represent selling pressure. Different candlestick patterns are analyzed to provide insights into potential trend reversals or continuations.
A case study is presented using the Ethereum chart to demonstrate the application of technical analysis. The article points out key support and resistance levels and uses indicators like the relative strength index (RSI) to gauge momentum.
The article also explores the charts of other cryptocurrencies such as Maker, Pendle, Jupiter, and Solana, discussing their price actions and indicating factors that may influence their growth.

In the latter part of the article, the author introduces essential tools for chart analysis, including CoinMarketCap and CoinGecko for gathering information on cryptocurrencies, TradingView for detailed chart analysis, and Dex Screener for tracking data from decentralized exchanges.
The article concludes by encouraging readers to check out a guide on profit-taking strategies and provides a subscription option for the Crypto Pragmatist newsletter.
Overall, the article provides a comprehensive analysis of chart reading in the crypto market, covering various concepts and tools. It offers valuable insights and guidance for beginners and experienced traders alike.
The article provides an in-depth exploration of chart analysis in the crypto market. It acknowledges that charts can be overwhelming for newcomers but aims to provide the tools to understand and interpret them. The article starts by emphasizing the need to view charts objectively, without being influenced by emotions triggered by the colors of candlesticks.
The article then explains the nature of markets as convergence points for buyers and sellers and introduces the concept of time value of money, highlighting the challenges of short-term trading compared to longer-term investments. It further explores concepts like the Dow Theory, which focuses on market trends and trend reversals, as well as support and resistance levels.
The Wyckoff Method is also discussed, which involves identifying market trends and potential price movements based on supply and demand dynamics, particularly in the phases of accumulation and distribution.
The article then delves into candlestick reading, explaining that bullish candles indicate buying pressure, while bearish candles represent selling pressure. Different candlestick patterns are analyzed to provide insights into potential trend reversals or continuations.
A case study is presented using the Ethereum chart to demonstrate the application of technical analysis. The article points out key support and resistance levels and uses indicators like the relative strength index (RSI) to gauge momentum.
The article also explores the charts of other cryptocurrencies such as Maker, Pendle, Jupiter, and Solana, discussing their price actions and indicating factors that may influence their growth.
In the latter part of the article, the author introduces essential tools for chart analysis, including CoinMarketCap and CoinGecko for gathering information on cryptocurrencies, TradingView for detailed chart analysis, and Dex Screener for tracking data from decentralized exchanges.
The article concludes by encouraging readers to check out a guide on profit-taking strategies and provides a subscription option for the Crypto Pragmatist newsletter.
Overall, the article provides a comprehensive analysis of chart reading in the crypto market, covering various concepts and tools. It offers valuable insights and guidance for beginners and experienced traders alike.
Gm anon! Today we have an exciting edition for you. The esoteric and mysterious world of charts! For the seasoned veterans out there, this report might be a little on the boring side, but if you’re new to crypto this is for you.
Charts can be frustrating for newcomers to the market, many are left scratching their heads not really sure what to take away from the images on their screens, numbers are flashing, and little candle sticks racing all over the screen. WHAT DOES IT ALL MEAN?!
Well, you’re in luck! That’s exactly what we’re going to get into today! Now, let’s set our expectations, you won’t be an expert overnight in this complex field, but we’ll give you the tools to get a gist of what a good chart looks like (and a bad chart!) and some great tools to start getting into this crucial and fascinating field.
At the end of the day, without charts how would we interpret or even assess a project?
First off, we’re going to break down some essential concepts, then we’ll move on to analyzing some great-looking charts, and help you read them on a fundamental level, next, we’ll take a look at some terrible-looking charts and finally, we’ll give you the tools to start fishing!
Be sure to keep an eye out for future editions in this series where we’ll be expanding on the information in this report!
Reading The Hieroglyphs
Now we know what you’re thinking, green candles GOOD, red candles BAD.
You would be right and wrong, but let’s zoom out…. good cannot exist without bad, light without dark and Coca-cola without Pepsi!
Periods of accumulation and distribution and vice versa are the nature of markets, learning to read what phase a chart is likely in is key! Learn to analyze without the emotional bias of the red and green affecting you.
Many traders will turn off the colors altogether, or even just view line charts in order to avoid the emotional bias that is triggered by the psychology of these colors!
We need to rather view charts through the lens of a roadmap, what is the path of the price telling us, and remember price is everything…. Everything else is discretionary.
Before we dive into the details, let's set the stage first by understanding what markets are and their origins.
Setting The Stage
Markets represent the convergence of buyers and sellers. In highly liquid markets like Bitcoin, millions of participants operate across various time frames to extract value from the market. Leverage is often utilized by traders to maximize their gains. Understanding the psychological zones affecting price is crucial, leading us to our next point.
Remember, markets are fractal, and the time horizon you choose to trade on is entirely up to you. We would suggest higher time frames for beginners, as lower time frames are highly competitive and require significant skill to be profitable.
Another key concept to introduce right now is
TIME VALUE OF MONEY.
With all participants aiming to extract value from the market quickly, it becomes increasingly challenging to make money in the short term compared to the longer term.
For instance, attempting to double your money trading BTC in the next week versus buying and holding spot until the end of the year. Which would be an easier endeavor? Holding until the end of the year in a market regime that is trending higher, of course!
Now, let's delve into some key concepts. While there are numerous approaches to the market, we'll focus on the absolute essentials to help you get started.
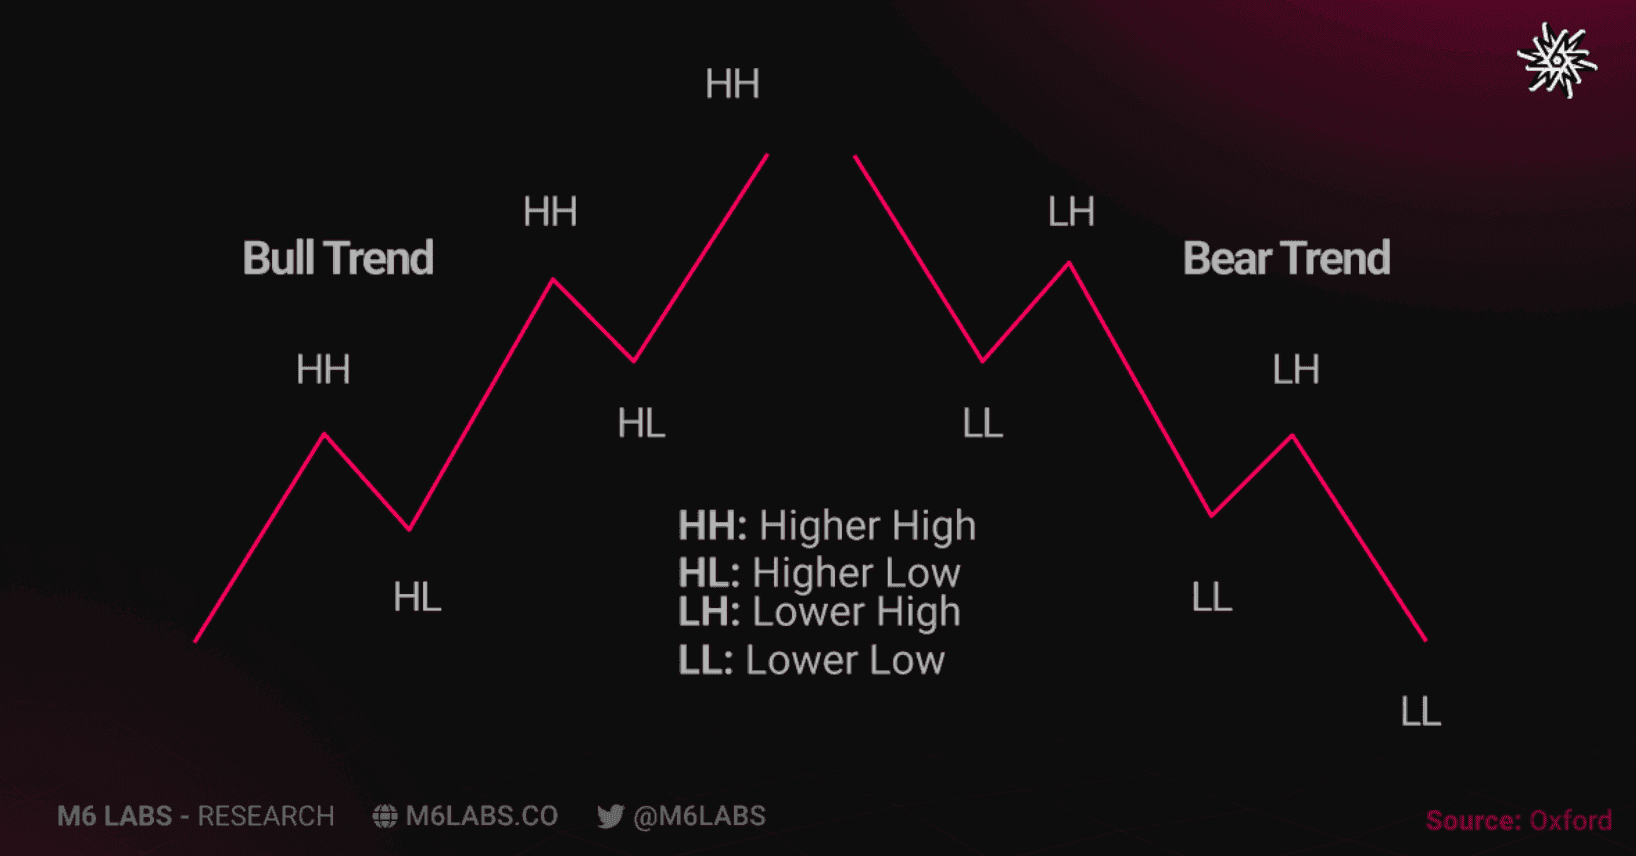
Dow Theory
Developed in 1896 by Charles Dow, observes market trends based on higher highs and higher lows, or lower lows and lower highs.
- To identify the direction of the market's primary trend. This theory emphasizes primary trends and their confirmation through indices like the Dow Jones Industrial Average, operating on the efficient market hypothesis, assuming asset prices already reflect all available information, and distinguishing between primary, secondary, and minor trends.
- Dow's approach focuses on trend confirmation through volume and index movements, suggesting that trends persist until a clear reversal occurs.
- Identifying trend reversals involves analyzing peaks and troughs, with reversals signaling changes in market direction.
- Overall, Dow Theory aims to guide trading decisions by understanding and reacting to shifts in primary market trends.
So in summary are we trending higher or trending lower? The chart below is a good example of what this looks like
This links onto…
Support and resistance are key concepts in trading. Support refers to a price level where a stock or asset tends to find buying interest, preventing it from falling further.
- Resistance, on the other hand, is a price level where a stock or asset tends to encounter selling pressure, preventing it from rising further.
- In simple terms, support acts like a floor, holding up the price, while resistance acts like a ceiling, capping the price.
- Traders use these levels to make decisions about buying and selling, with support often seen as a potential entry point for buying and resistance as a potential point to sell.
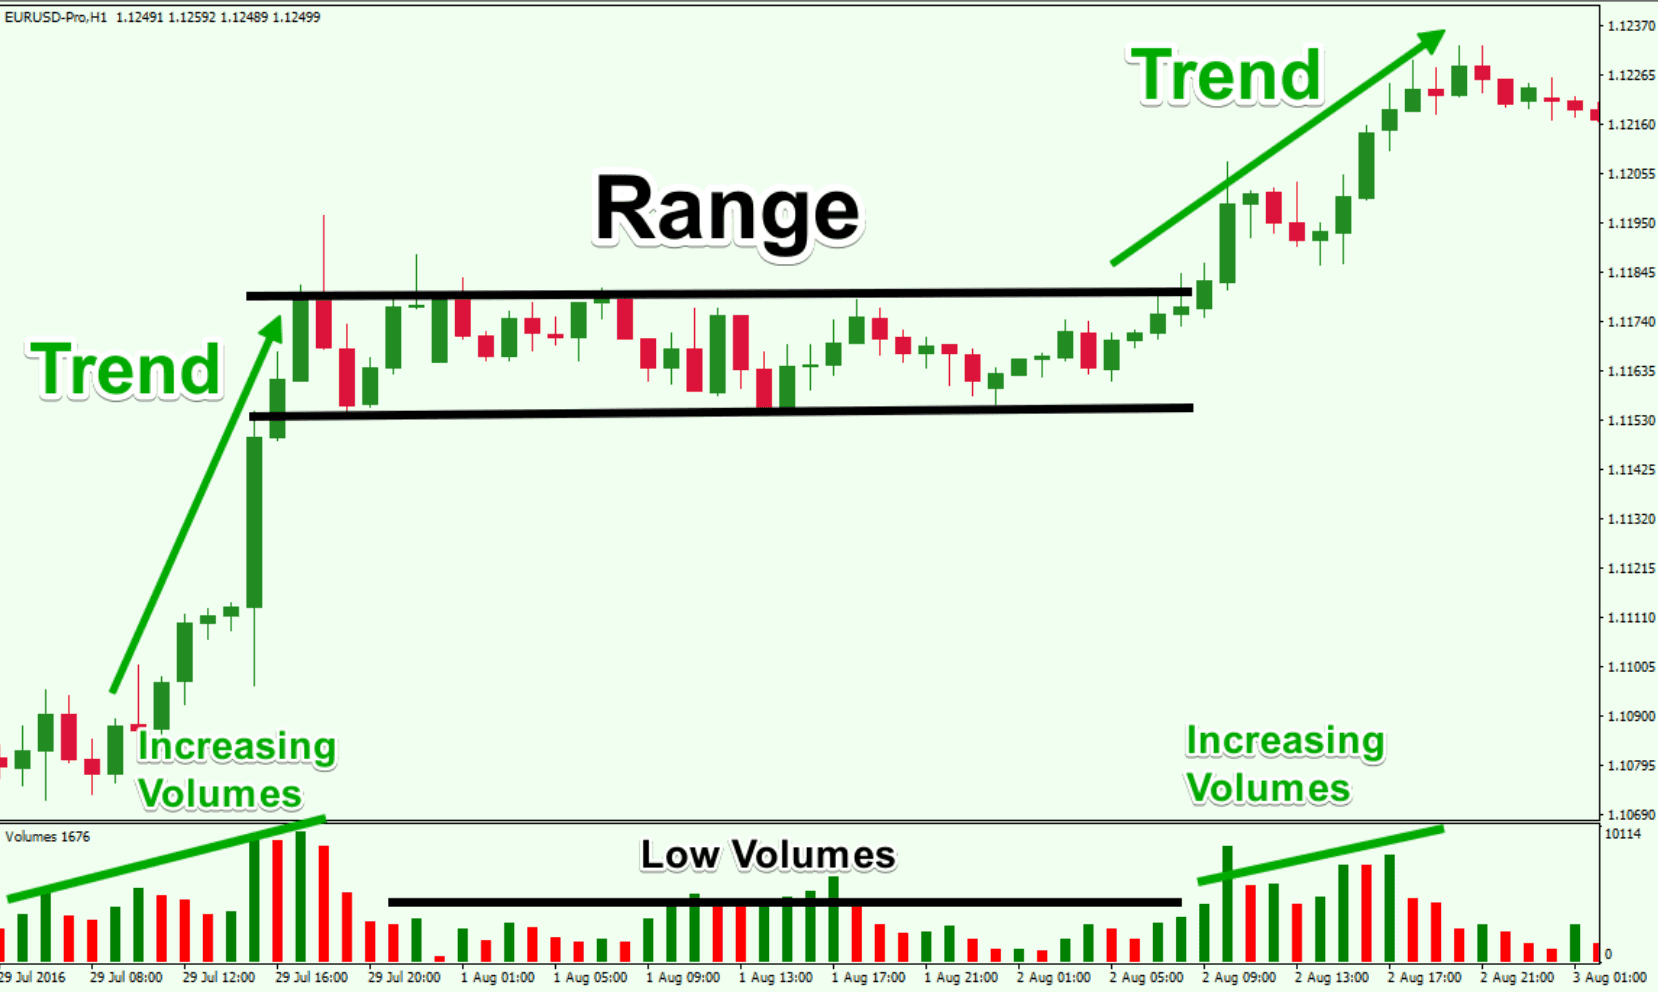
Now, let's delve into the concept of a market range.
In trading, it's common for assets to exhibit ranging behavior for a significant portion of the time. But what exactly does "ranging" mean in this context?
- Ranging refers to a market condition where the price of an asset fluctuates within a relatively narrow range or channel over a certain period, without showing a clear trend in either direction.
- During ranging periods, the price tends to move horizontally rather than trending upward or downward.
- This typically occurs when supply and demand for the asset are relatively balanced, leading to price consolidation within a defined price range.
- Ranging markets are characterized by frequent price reversals near support and resistance levels, making it challenging for traders to profit from directional moves.
- Traders often use various technical indicators and chart patterns to identify ranging conditions and adjust their trading strategies accordingly, such as employing range-bound trading strategies or waiting for breakouts from the range to establish new positions.
Now onto the next crucial theory to understand after Dow Theory.
The Wyckoff Method
The Wyckoff Method is a trading approach developed by Richard D. Wyckoff that focuses on identifying market trends and potential price movements based on the principles of supply and demand.
- Central to this method are the concepts of accumulation and distribution.
- Accumulation refers to the phase in which smart money or institutional investors are actively buying an asset, often at lower prices, with the anticipation of future price appreciation.
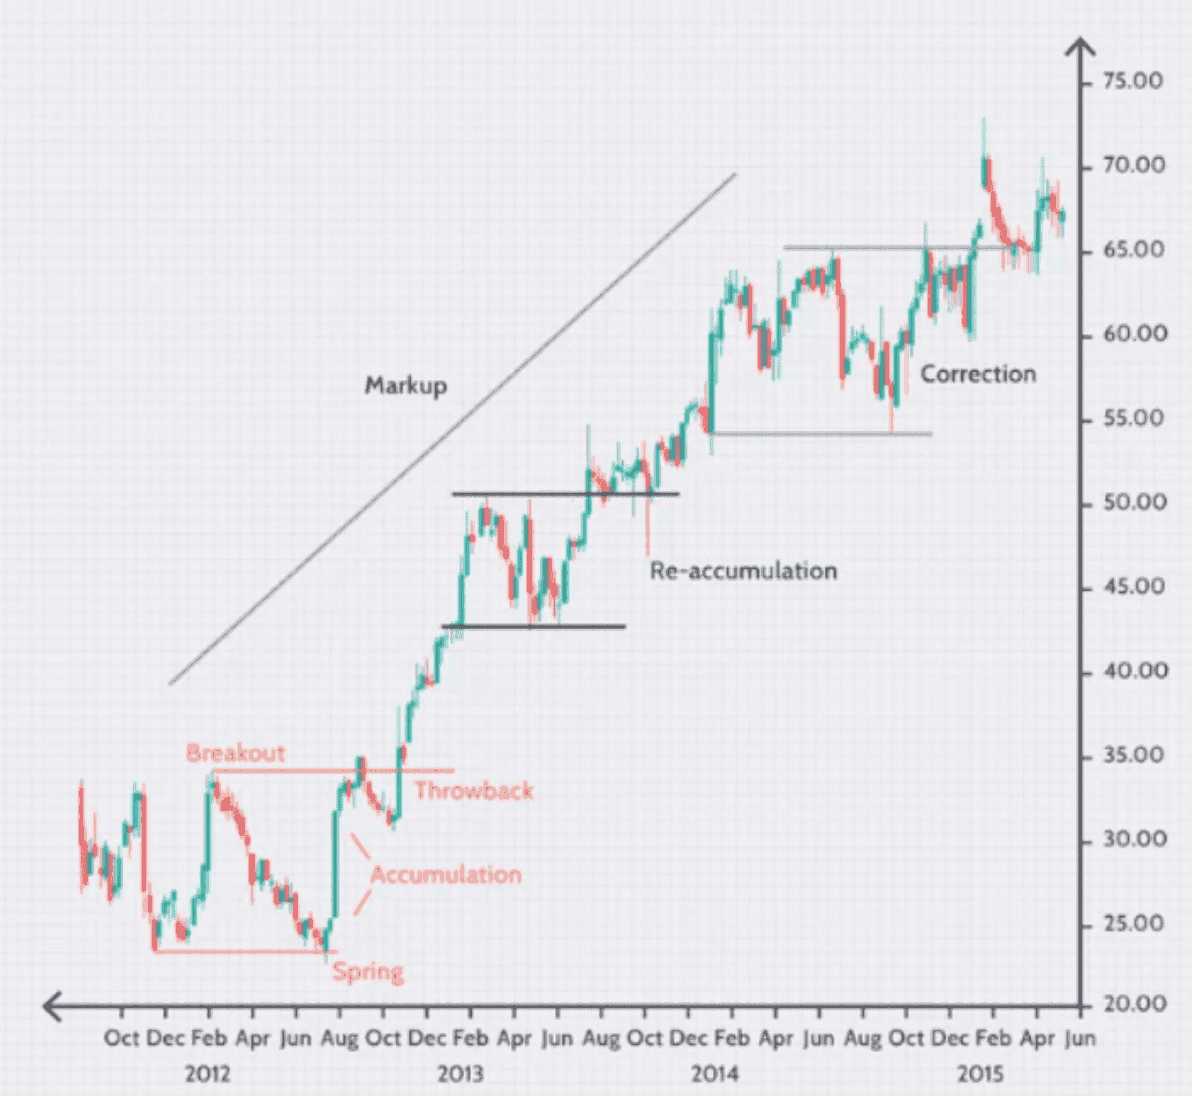
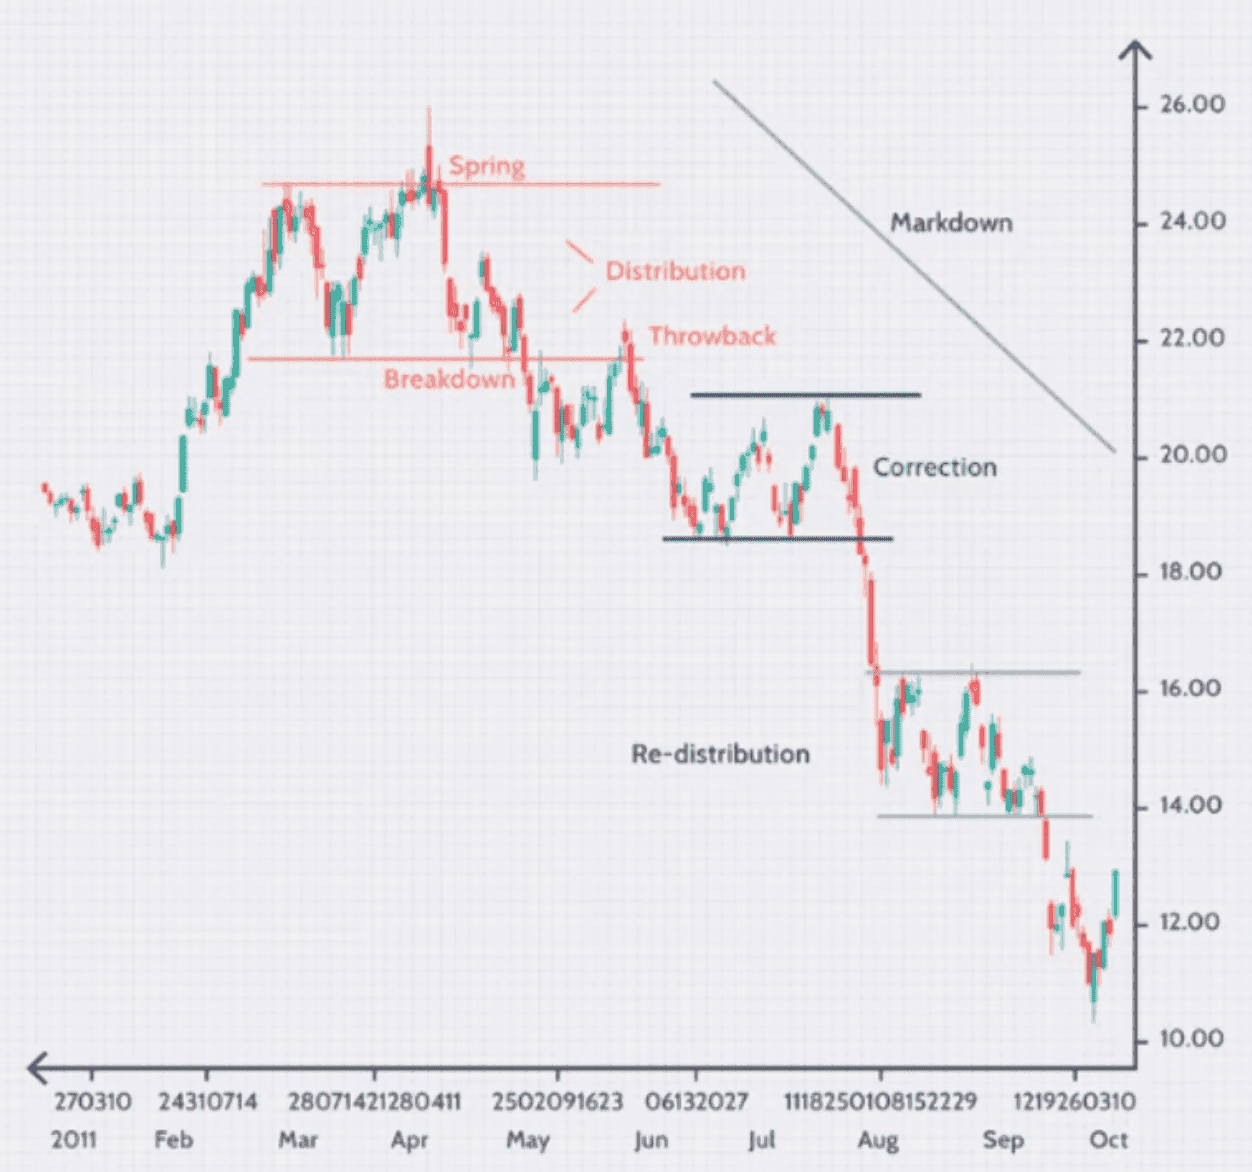
- On the other hand, distribution occurs when these investors start selling their accumulated holdings to the broader market, often at higher prices, signaling a potential reversal or downtrend.
- By understanding these phases and their accompanying price action, traders using the Wyckoff Method aim to make informed decisions about when to enter or exit positions in the market.
Finally, here are some concise notes on candlesticks and their interpretation.
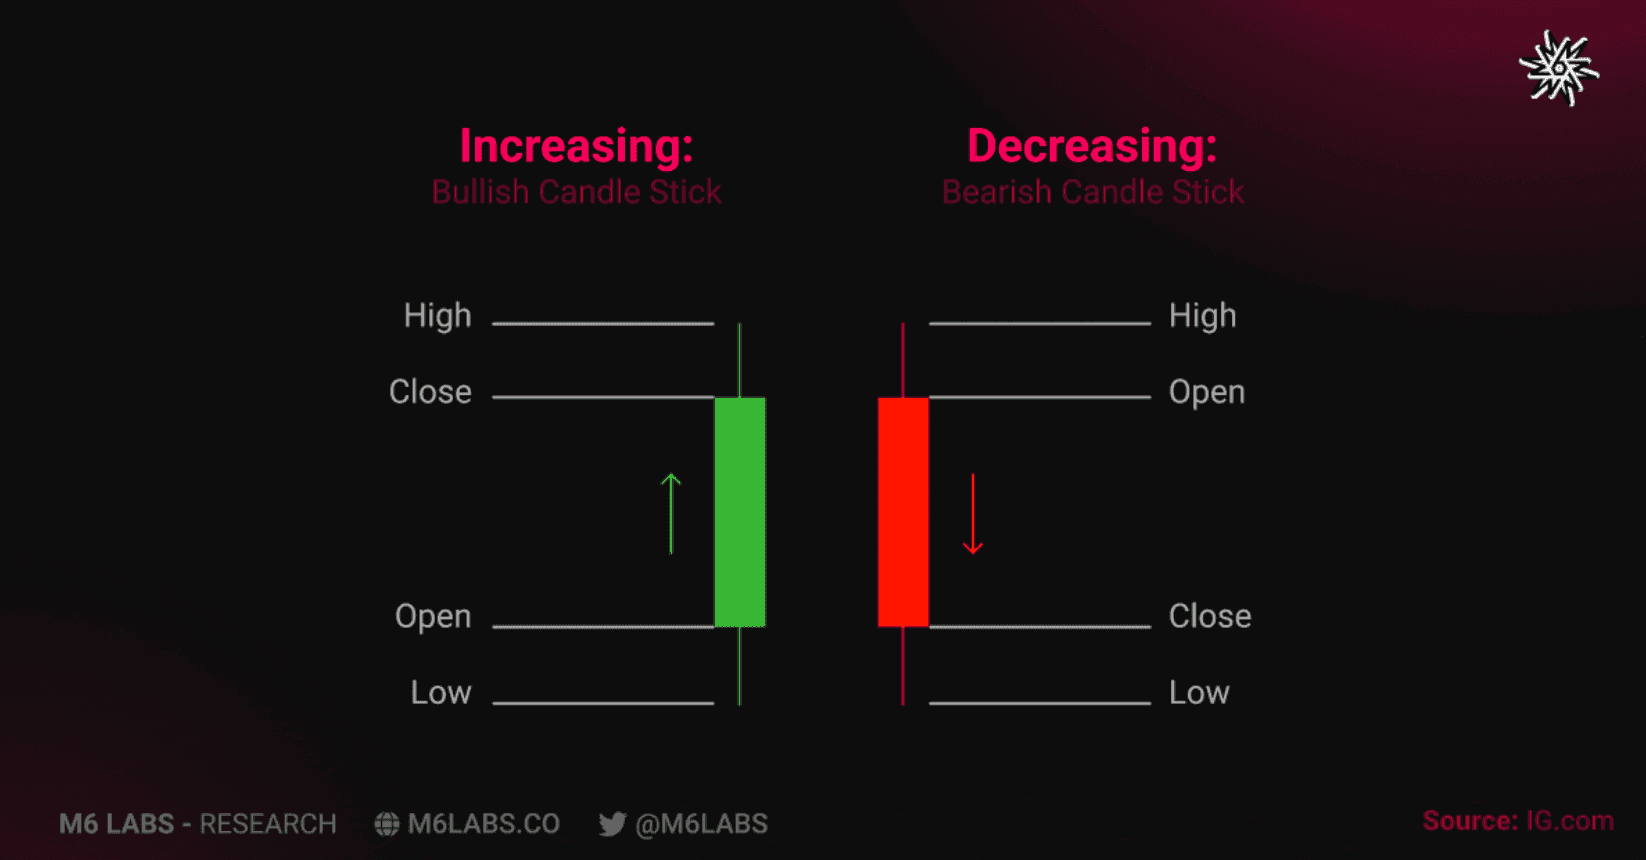
Candlesticks
Candlestick reading originated in Japan in the 18th century, initially used by rice traders to analyze market emotions and predict future price movements. Reading candles on a fundamental level involves understanding the story they tell about market sentiment and price action.
Bullish candles indicate buying pressure and optimism, while bearish candles signal selling pressure and pessimism. Patterns formed by consecutive candles provide insights into potential trend reversals or continuations.
Analyzing candlestick patterns in conjunction with other indicators and fundamental factors helps traders make informed decisions about market direction and potential entry or exit points.
To read a candlestick in trading, you look at its components: the body and the wicks.
- The body represents the opening and closing prices of a trading period, while the wicks show the high and low prices reached during that period.
- A bullish candle has a green body, indicating that the closing price is higher than the opening price, while a bearish candle has a red body, indicating the opposite.
- The length of the wicks shows the price range and volatility during the period.
Let's examine a practical application of the concepts we've just discussed in a real-world scenario.
Case Study – Technical Analysis in Action
Now that we've learned how to analyze charts and price trends let's try it out. Let's take a look at the Ethereum chart together.
The first thing you need to do is go to TradingView and choose your preferred timeframe for the Ethereum chart. If you are interested in intra-day price movements, then 1-hour and 4-hour charts could be pretty handy. However, we primarily use the 1-day (or daily) charts since they give us a more comprehensive outlook.
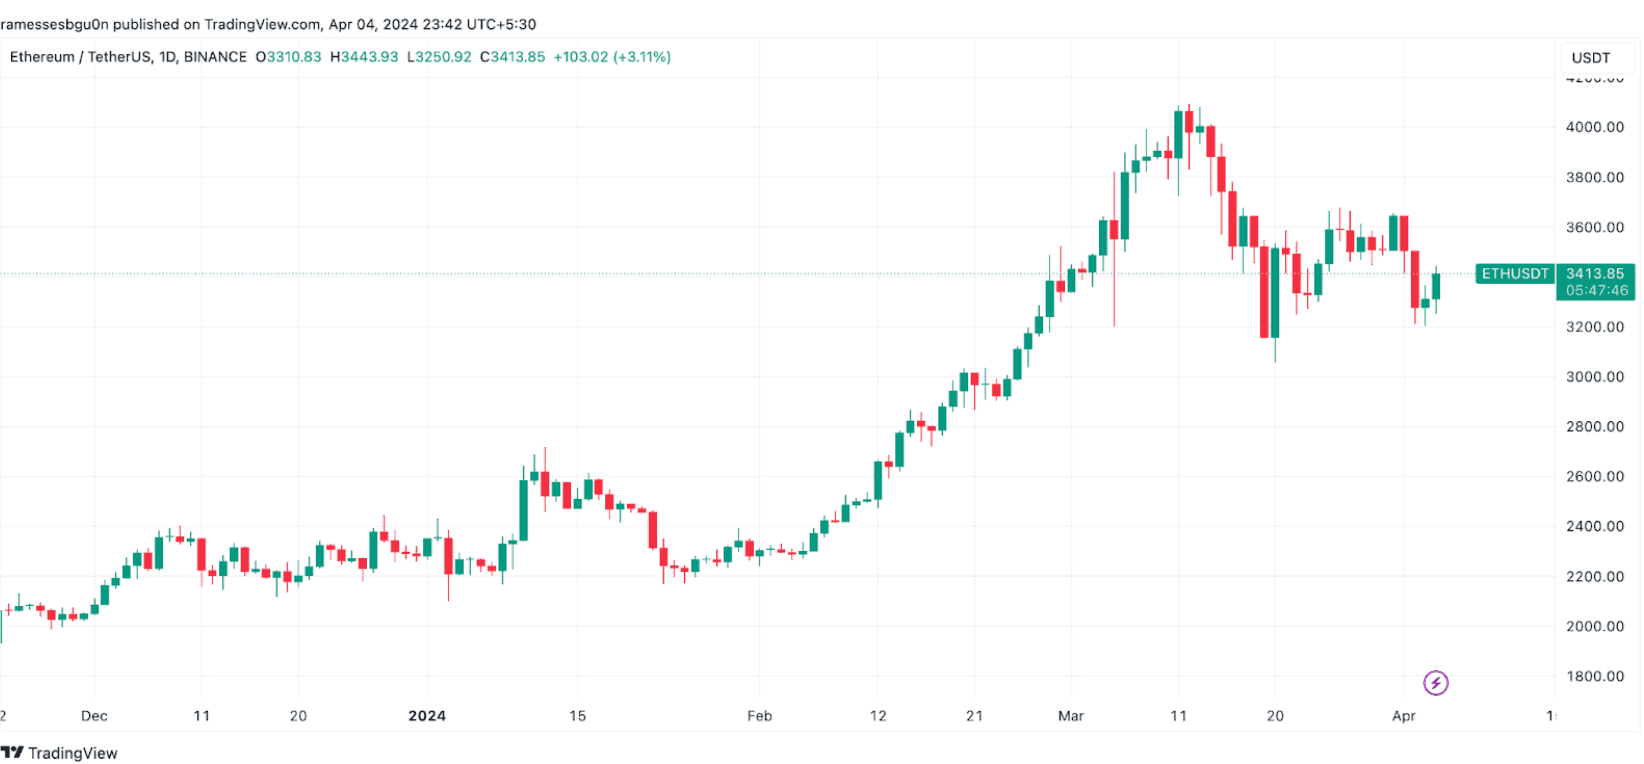
As you can see, the bulls have been in control with an up trending chart before we hit a wall above $4000. Now, there is a very obvious resistance area that we can draw at $3,500.
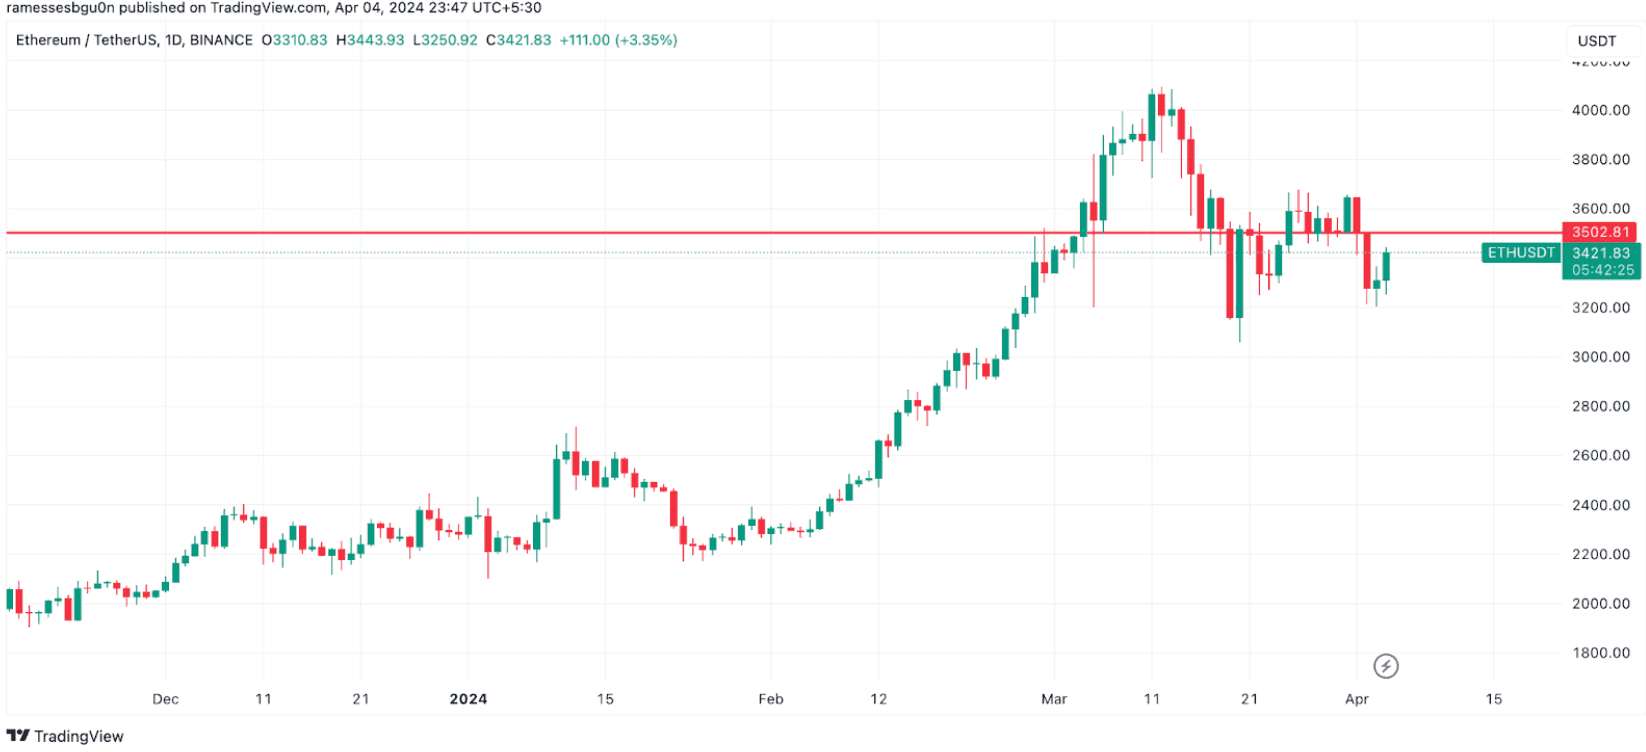
This resistance zone is prominent for two reasons.
First, the line had previously offered support in this channel 👇
Usually, when the price breaks below a strong support line, the latter ends up becoming a formidable resistance wall.
Secondly, “$3,500” is a strong psychological price point. Many traders may wait for the price to reach $3,500 before dumping their coins.
Regardless, breaking this barrier will be a super win for the bulls.
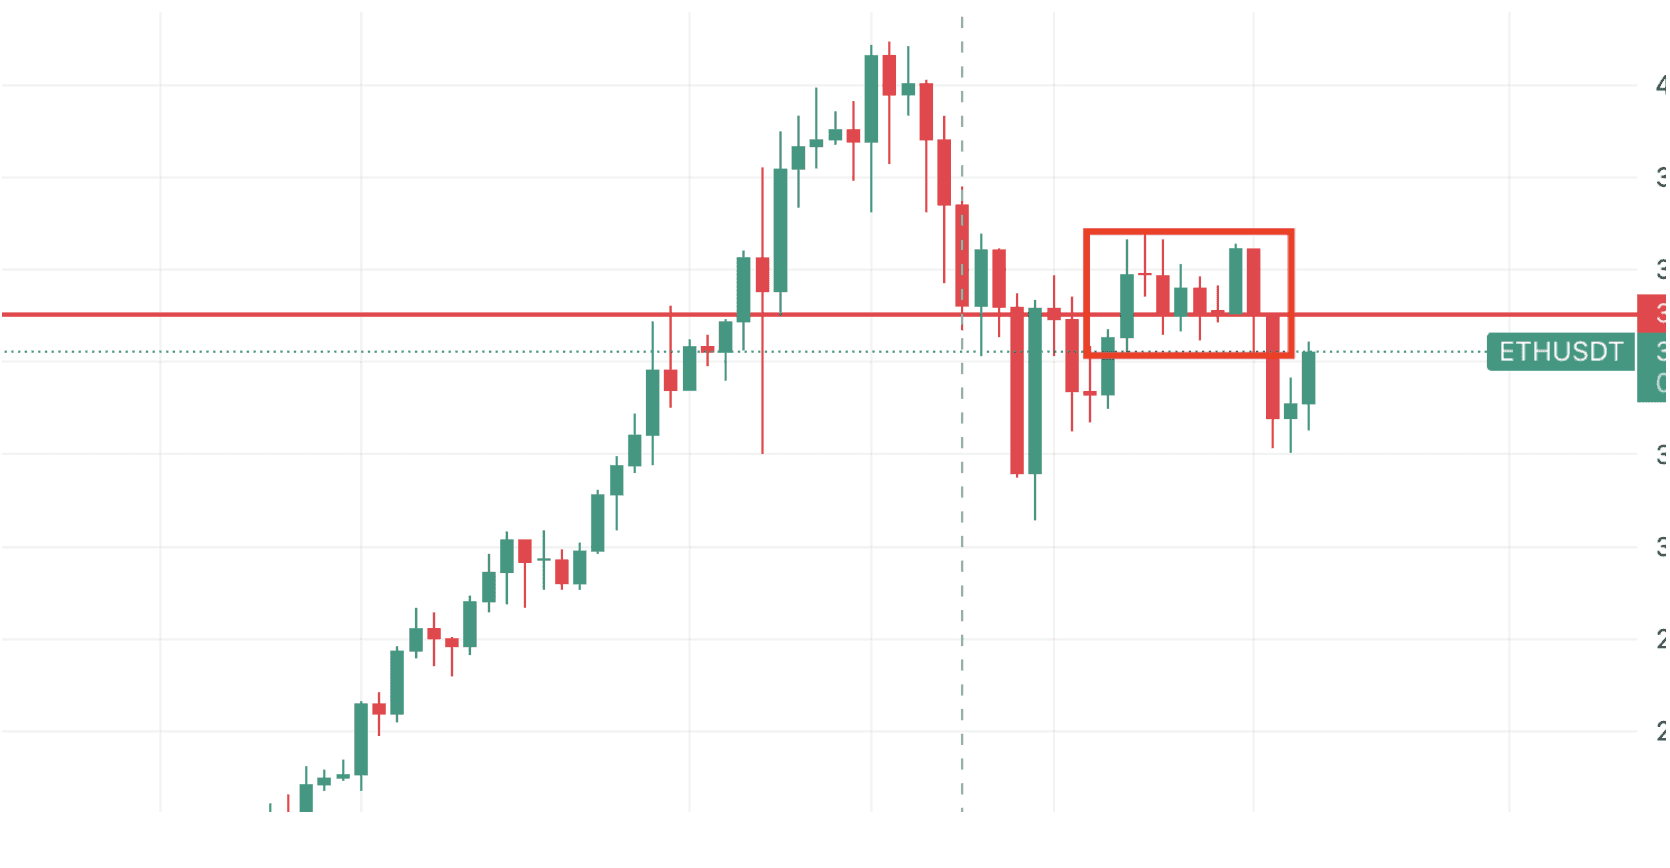
Let’s zoom out on this chart and look at Ethereum’s recent price action.
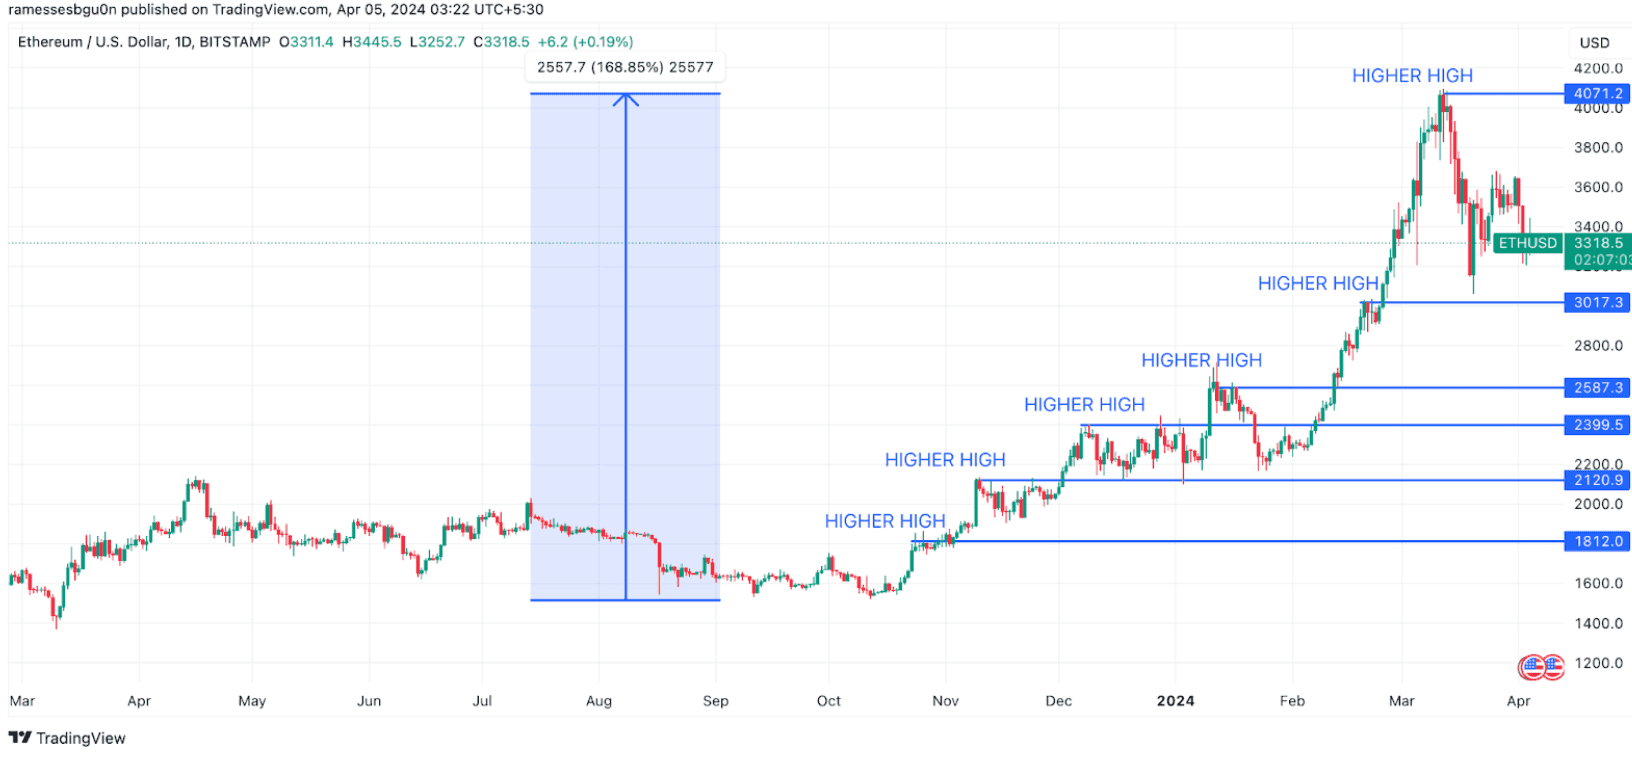
Ethereum has been on an upward trajectory since October 2023. Between October 2023 and March 2024, the price jumped by 169%, plotting several higher highs along the way. This shows that the ETH price action was extremely bullish during this period.
Prior to this explosion, notice this period of horizontal movement.
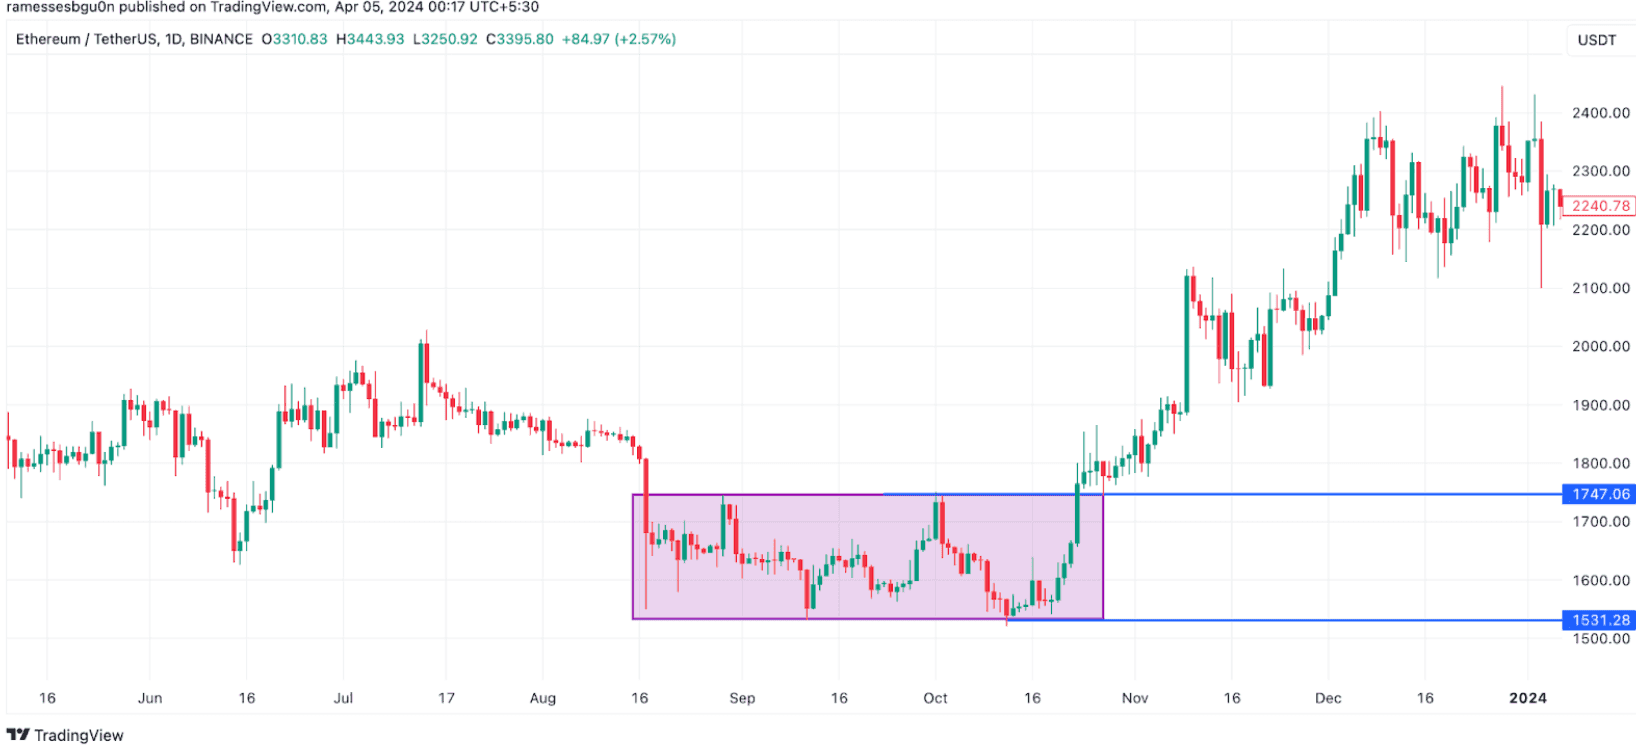
For two months, between August and October 2023, the Ethereum price trended in a tight range between $1,530 and $1,750. This is known as an accumulation period. In this period, the buyers are accumulating coins and prepping for a breakout.
Let’s go back in time a bit more.
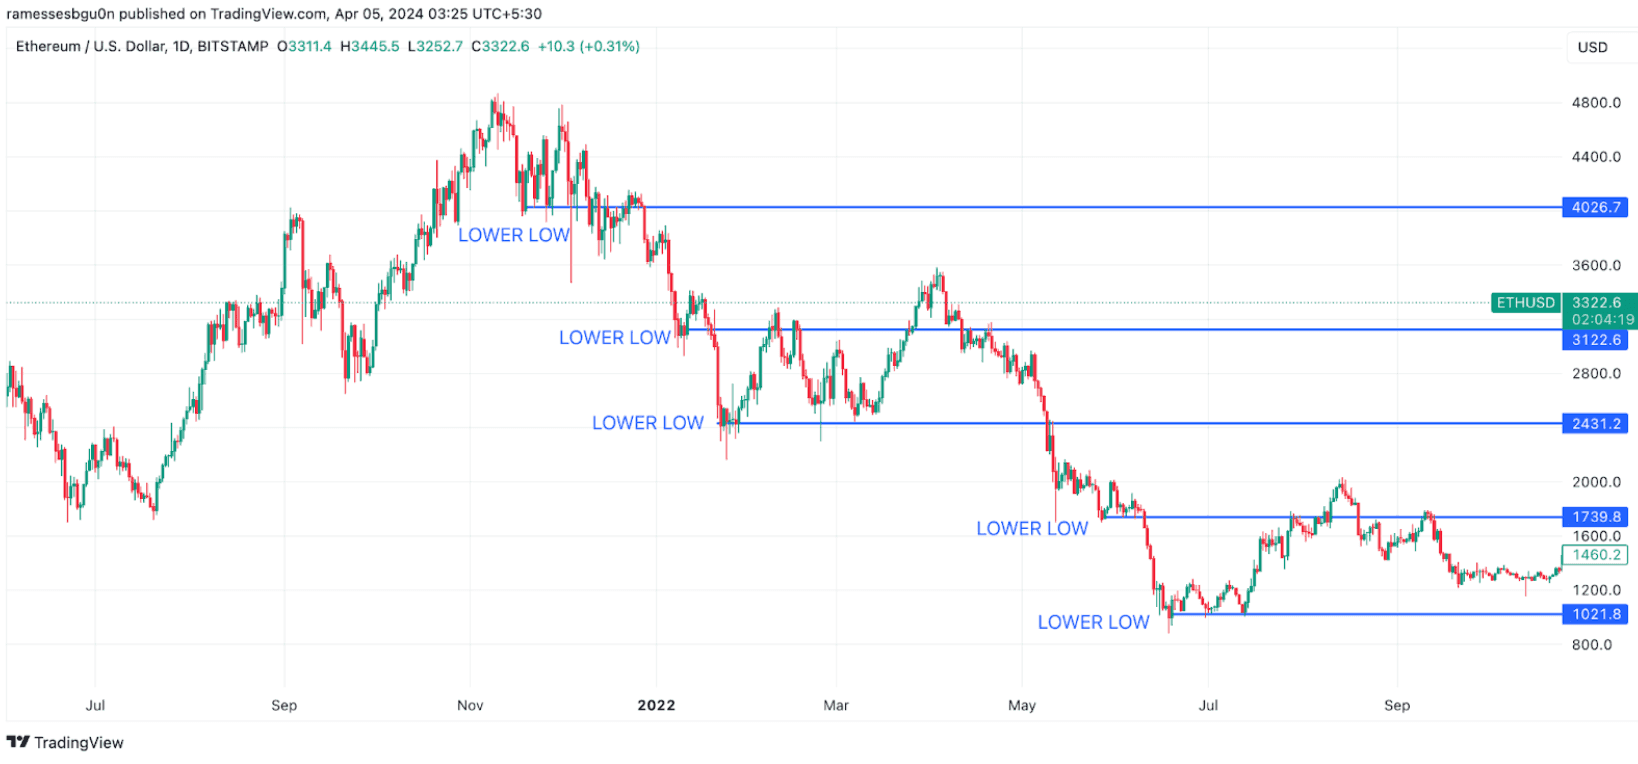
This chart shows the brutal bear market of 2021-2022. We know… we hate watching this chart—but let’s power through it. The price plummeted from its all-time high (~$4,878) to ~$1,000 during this period.
As you can see, the ETH chart had multiple lower-lows on its way down. The bulls desperately tried to stem the flow, but the bears ultimately broke through all the barriers.
What will ETH do next?
Let’s try to use some basic technical analysis to get some idea about what ETH will do next. Now, before we proceed, bear in mind that technical analysis is not an exact science. You should never make your assumptions based only on technical analysis. It should be one of the many tools that you can use to get a clearer picture of the overall narrative.
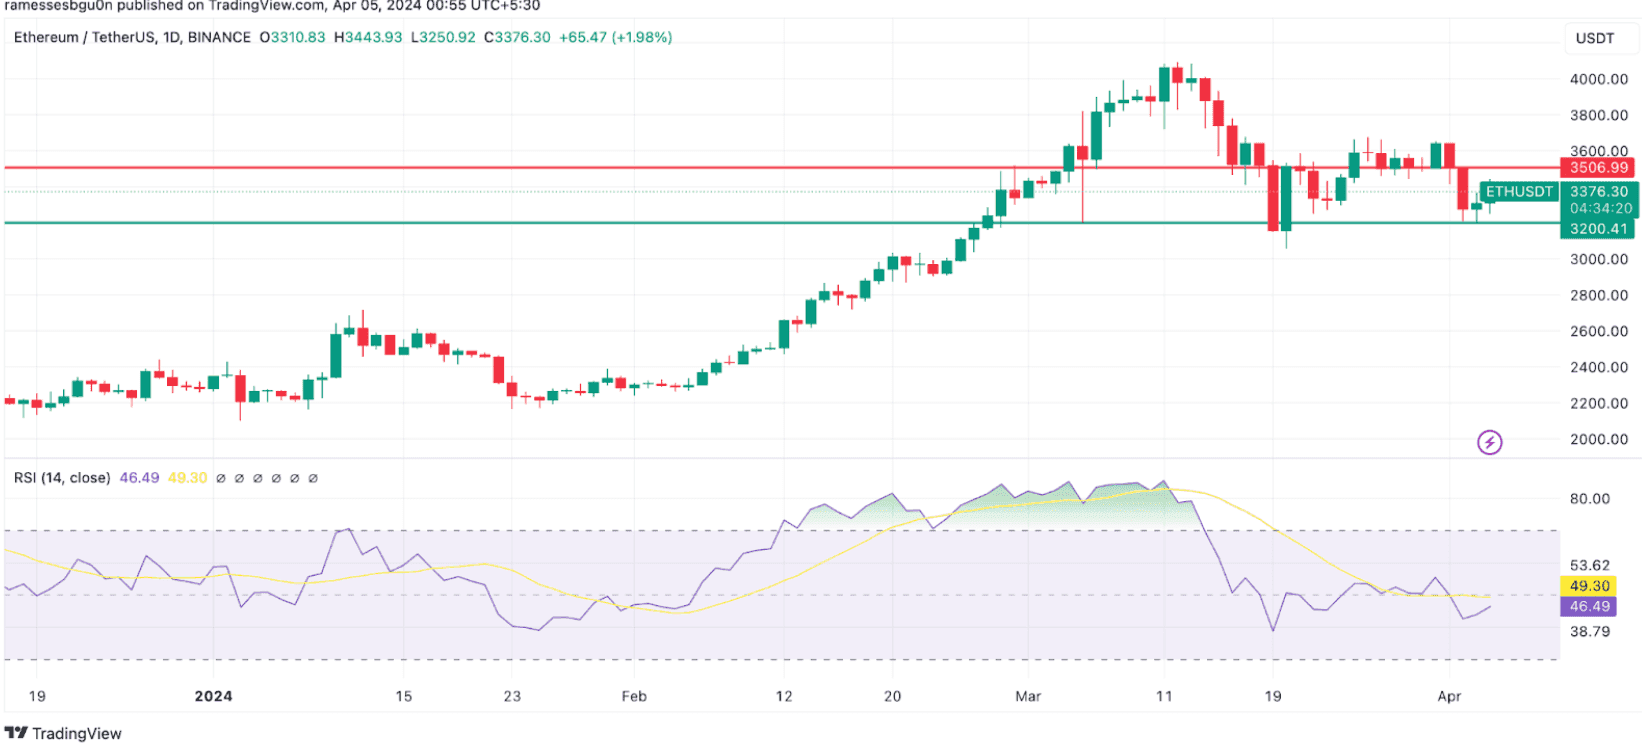
We have previously determined that $3,500 is a strong resistance barrier. $3,200 is our support wall. For ETH to reach new highs, we must conquer the $3,500 resistance. We can use an indicator to give us an idea about the price momentum.
Readers of our last email will be familiar with the relative strength index (RSI) indicator. This indicator is a momentum oscillator that hovers between 0 and 100. These are the conclusions you can make:
- RSI between 30 and 70 = Normal
- RSI less than 30 = Asset is oversold (bulls might take over soon)
- RSI more than 70 = Asset is overbought (bears might take over soon)
Given the RSI for ETH is currently around 45, there is potential for bullish momentum to drive the price higher before the asset enters the overbought territory.
So, Ethereum definitely has the momentum and the space to break past $4,000.
If you want to dive deeper into TA be sure to read this Crypto Pragmatist piece, The Five Cardinal Sins of Crypto Technical Analysis to further up your game and avoid mistakes when it comes to TA.
Moving on from Ethereum.
It's always intriguing to see which cryptos are leading the pack.
This is doubly true in a bull market where it's not just interesting but essential to spot the front-runners.
That's why we're zoning in on Maker, Pendle, Jupiter, and Solana - and how they have been lighting up the charts.
In the green pastures of a bull market, the winners tend to keep winning. By analyzing them thoroughly, we will be able to recognize the factors that propel these coins forward.
Let's decode the success stories of our chosen coins.
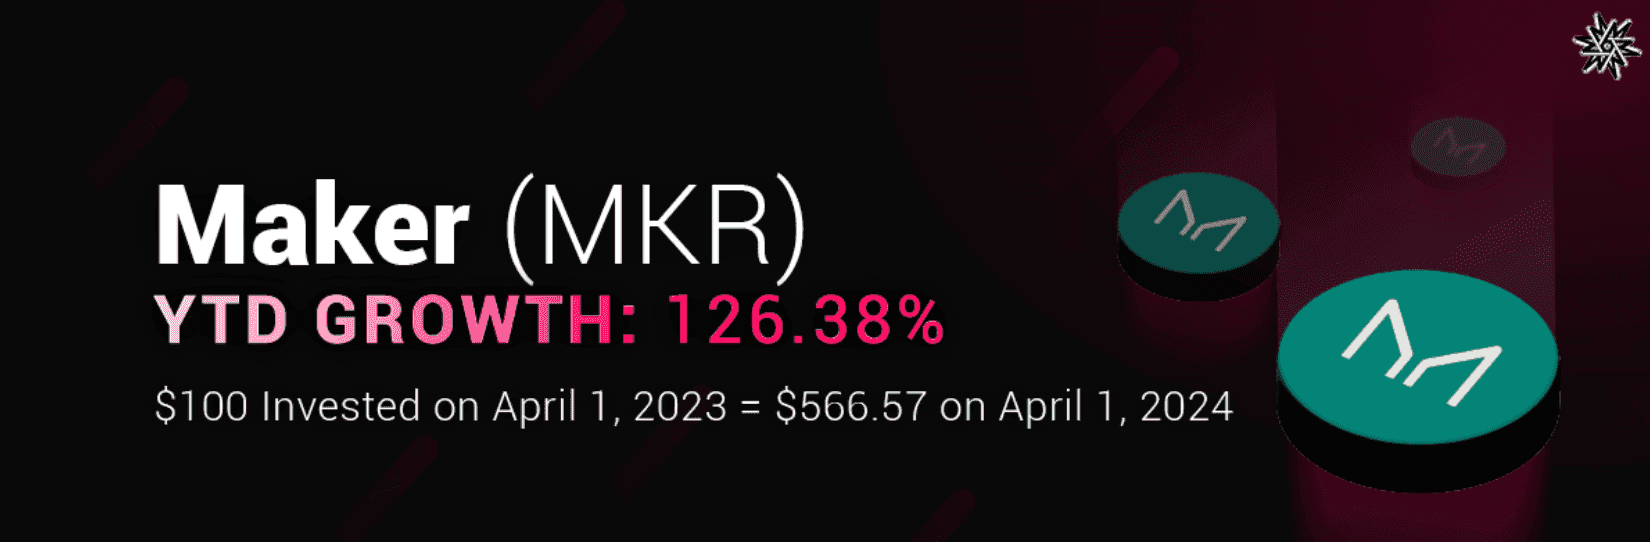
Maker (MKR)
- TVL: $8.39b
- Fully Diluted Valuation: $3.765b
- Fees (Annualized): $338.61m
- Revenue (Annualized): $217.03m
First up, we have Maker’s MKR. Since December 25, 2022, when it hit $550, it has jumped almost 7X, hitting ~$3,800. The all-time is at $6,292, giving MKR significant room for growth.
MKR Technical Analysis
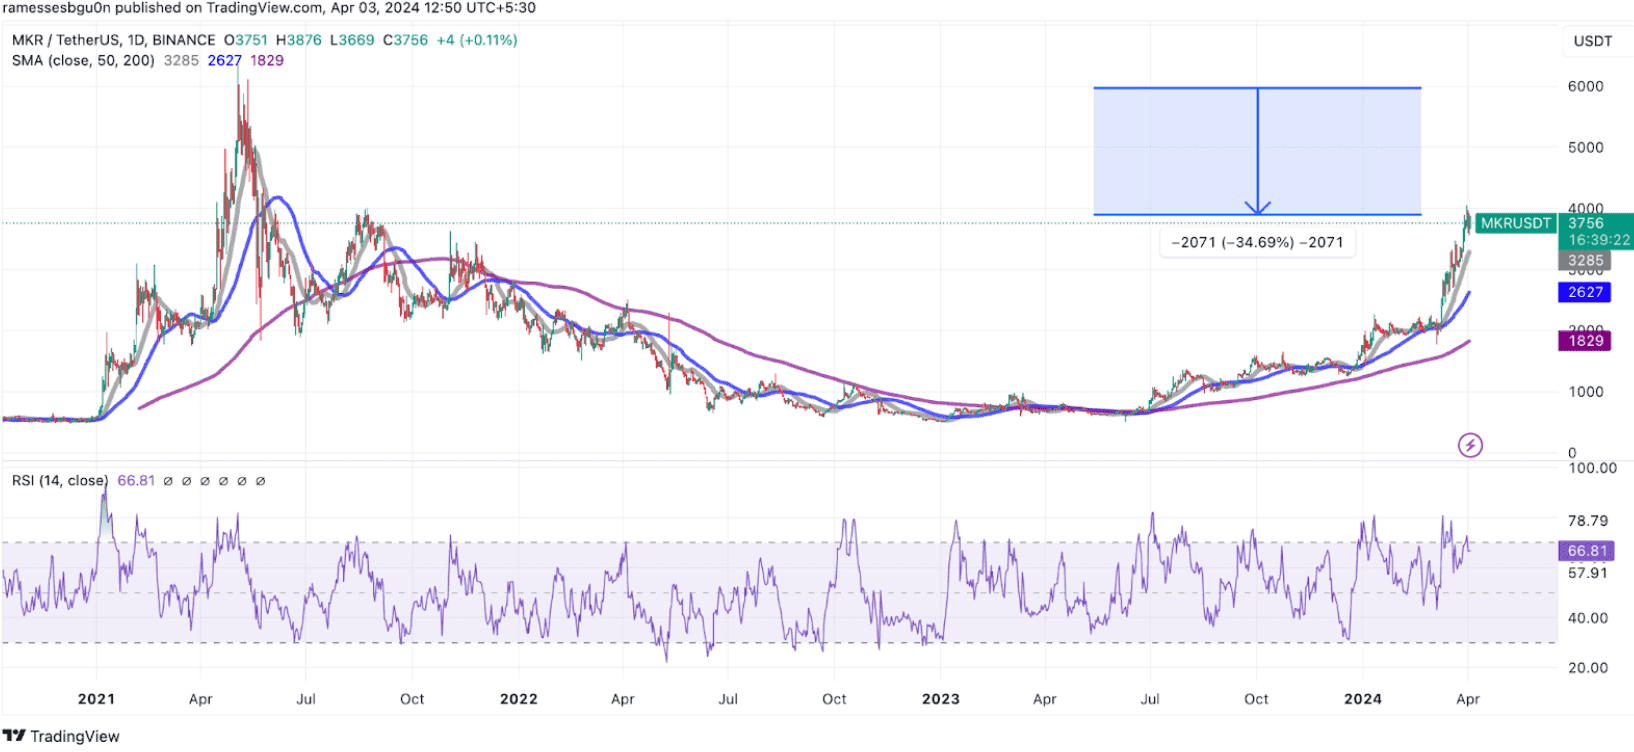
MKR price chart looks pretty promising as it looks to cross the $4,000 psychological level. On the downside, we observe two significant support walls at $3,700 and $3,300, with the former serving as the linchpin in this financial architecture.
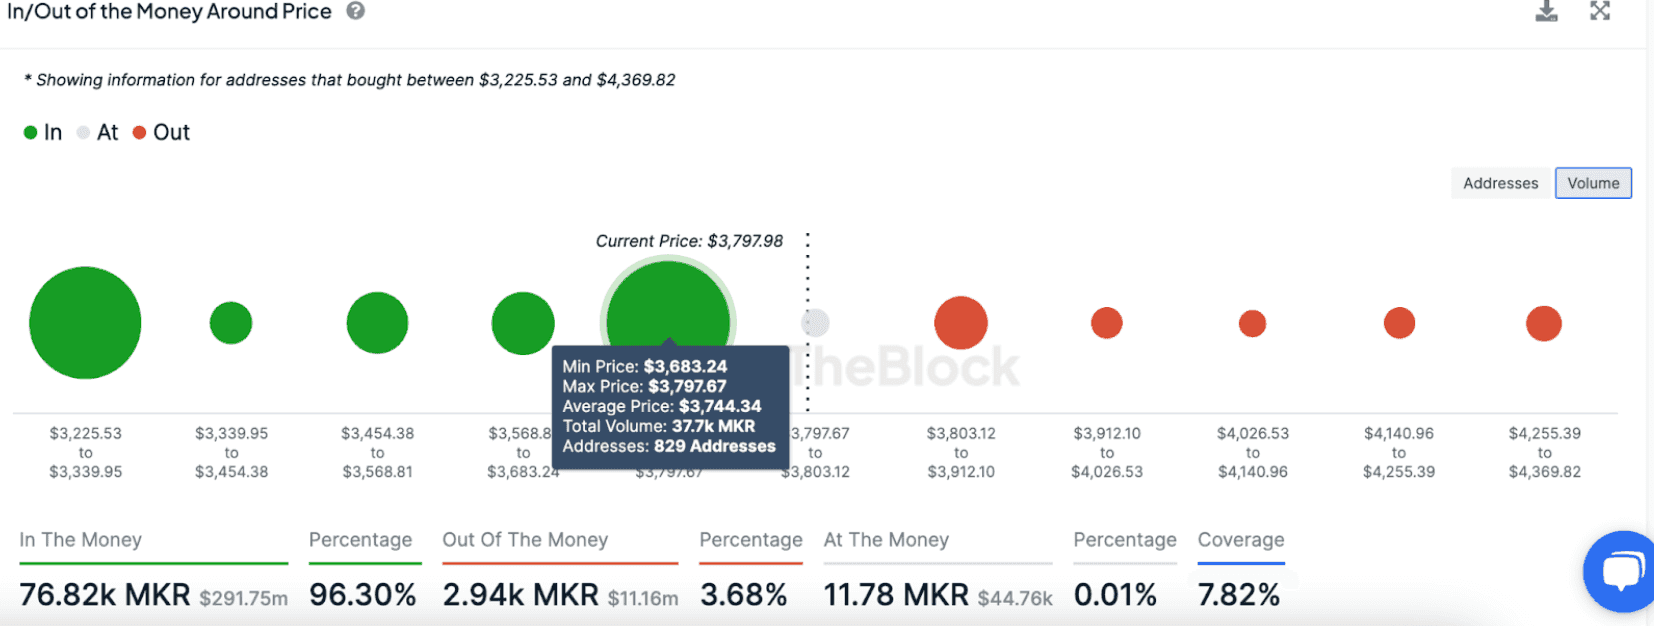
Insights from IntoTheBlock illuminate a compelling narrative: 829 entities have collectively anchored their faith (and finances) in 37,700 MKR tokens at this pivotal $3,700 mark.
The relative strength index (RSI) tells us that the price is tantalizingly close to the overbought threshold, hinting that a bit of a cooldown might just be around the corner.
MKR is still a good 35% shy of its all-time high. With the 20-day and 50-day SMAs providing a trusty safety net, things are looking rosy.
Factors determining growth
Maker is currently going through one of its most important updates, namely the Endgame proposal.
MakerDAO's "Endgame" plan involves a major rebranding, scaling its Dai stablecoin, and introducing new tokens and yield farming opportunities through SubDAOs. The plan starts with rebranding in mid-2024, followed by new token launches, including "NewStable" and "NewGovTokens." Key features include the "Lockstake Engine" for token yield farming and "NewBridge" for low-cost layer-2 farming, leading to a new layer-1 blockchain, "NewChain." The aim is to enhance user growth and platform resilience.
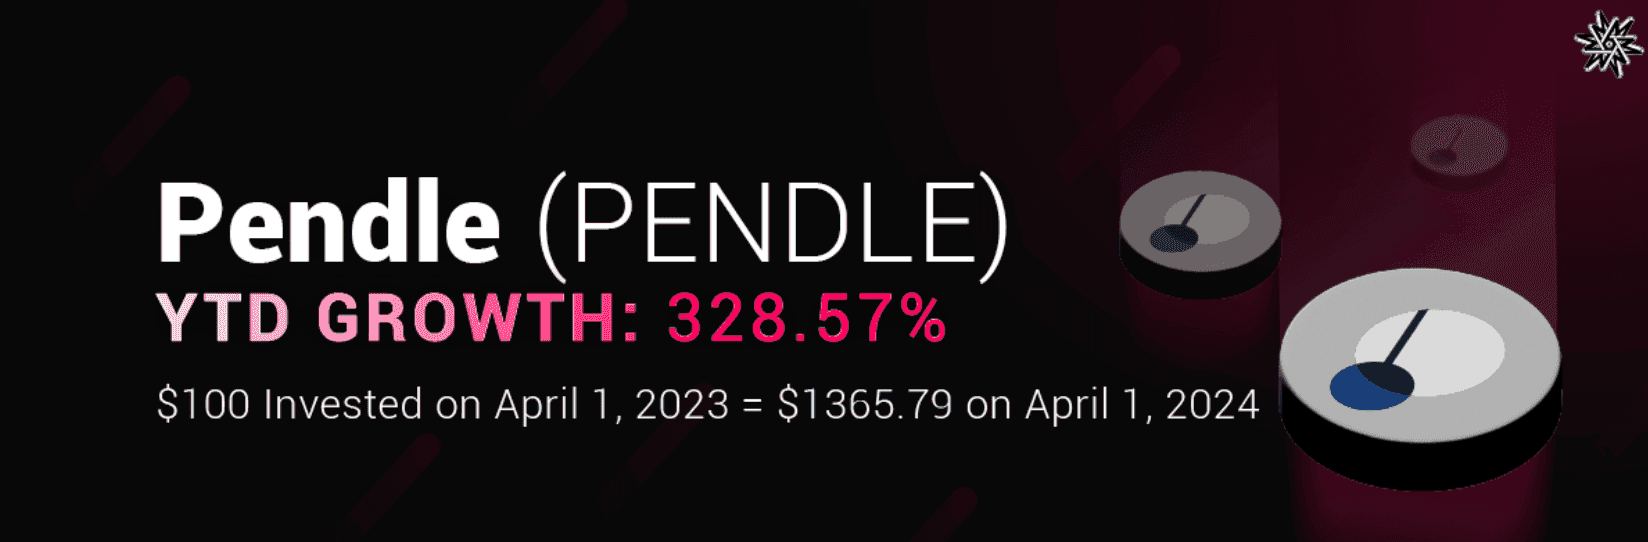
Pendle (PENDLE)
- TVL: $3.745b
- Fully Diluted Valuation: $1.295b
- Fees (Annualized): $18.8m
- Revenue (Annualized): $18.8m
Since January 1, 2023, PENDLE has pretty much 100X’d. The coin reached its all-time high of $5.76 on April 1, 2024.
PENDLE Technical analysis
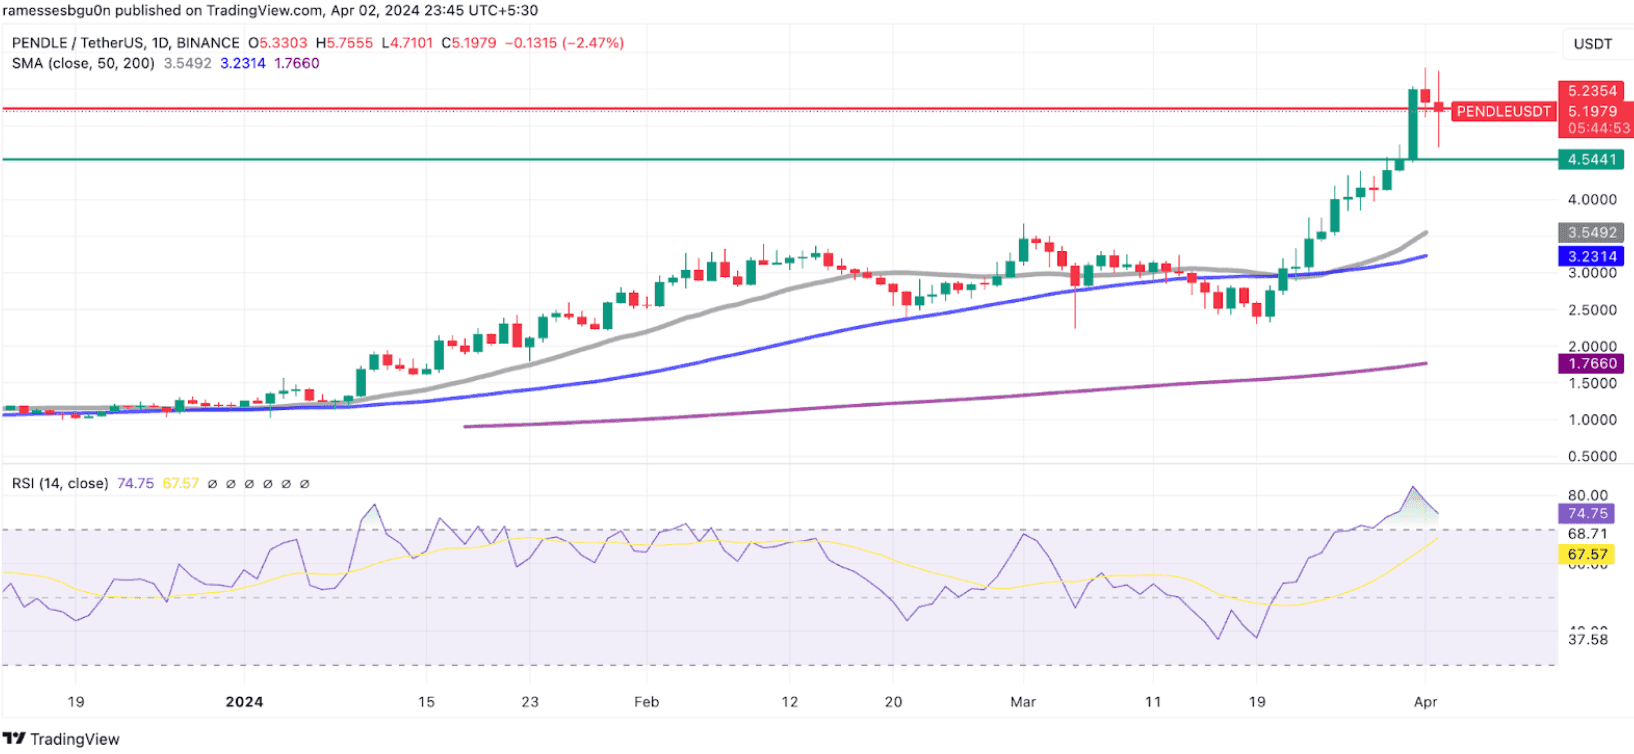
After riding the high of three bullish sessions, PENDLE's chart took a dip during the next two, slipping beneath the crucial $5.22 marker.
Currently, the RSI still loiters in the overbought territory, hinting at potential turbulence ahead.
Should the bearish momentum persist, we might see PENDLE descending towards the $4.50 support level.
IntoTheBlock's data reveals a fortress at this price point, with 700 addresses holding a collective ~303,000 PENDLE tokens, standing ready to defend.
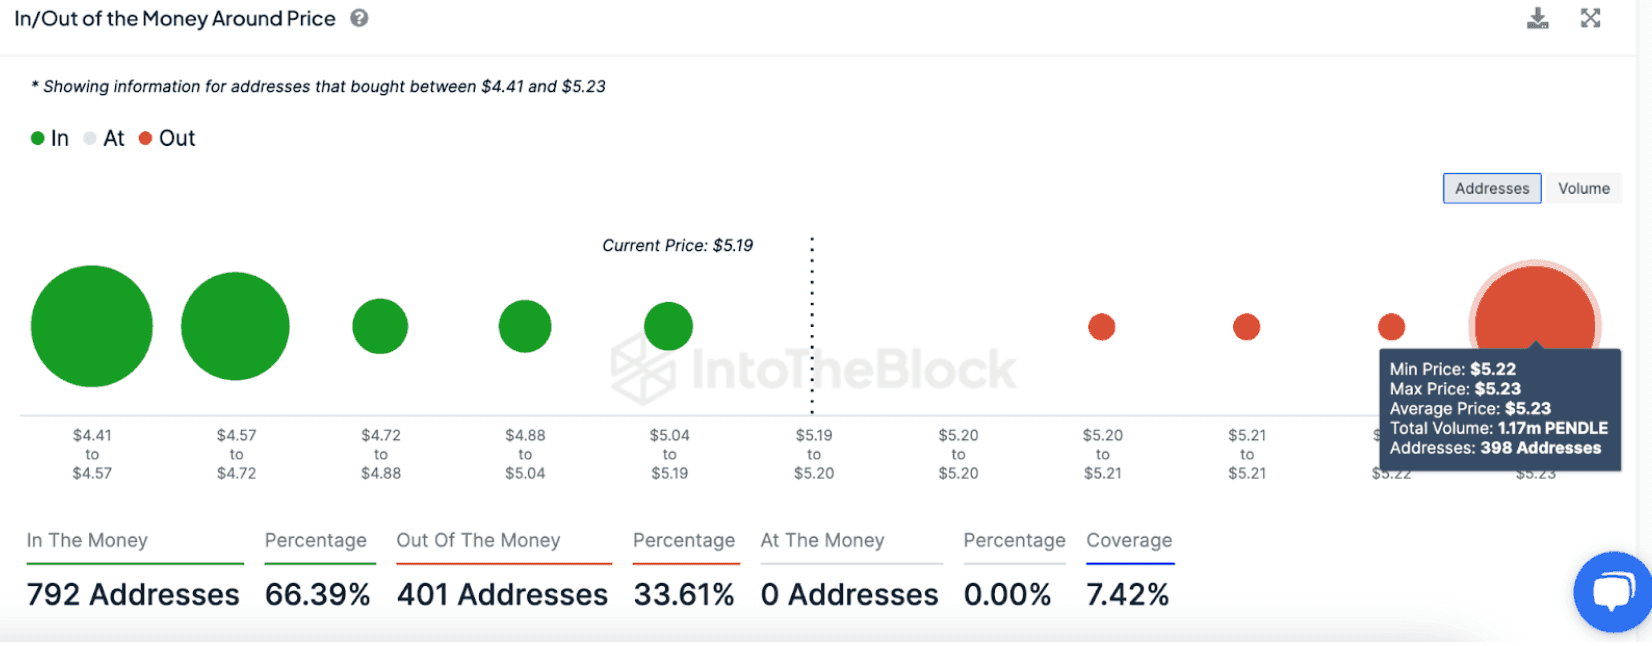
For PENDLE to reverse its course and climb back up, it's imperative for the bulls to recapture the $5.22 threshold, steering clear of the bearish undertow.
Factors determining growth
Pendle's remarkable growth can be attributed to the rise of liquid staking derivatives (LSD), a sector that has rapidly gained prominence within DeFi. Following Ethereum's Shanghai upgrade, LSDs started attracting significant liquidity, outpacing traditional stalwarts like decentralized exchanges and lending platforms.
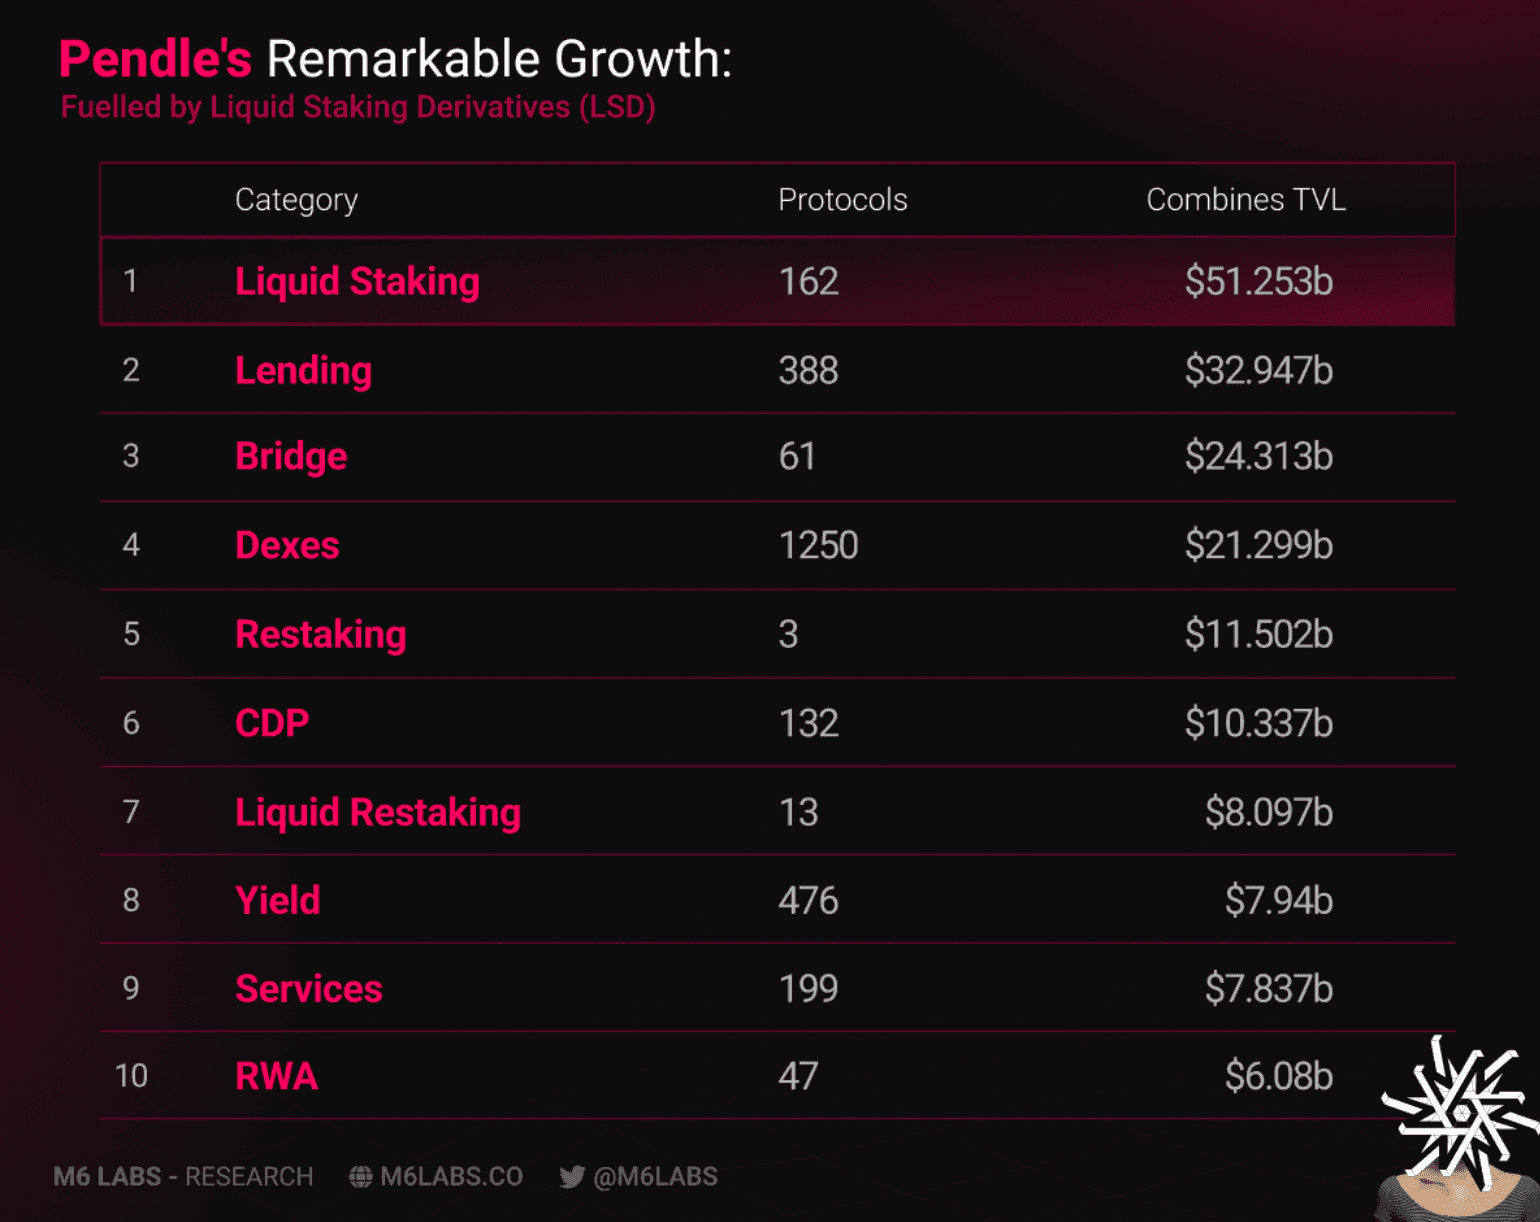
Along with this surge in LSD popularity, Pendle also benefited from its unique interest rate swap protocol that capitalizes on future yield-bearing assets. This innovative approach allows users to tailor their investment strategies according to their risk preferences, with a level of precision and flexibility previously unseen.
Pendle’s TVL is on the verge of touching $3.60 billion, making it the 9th largest DeFi app in the world.
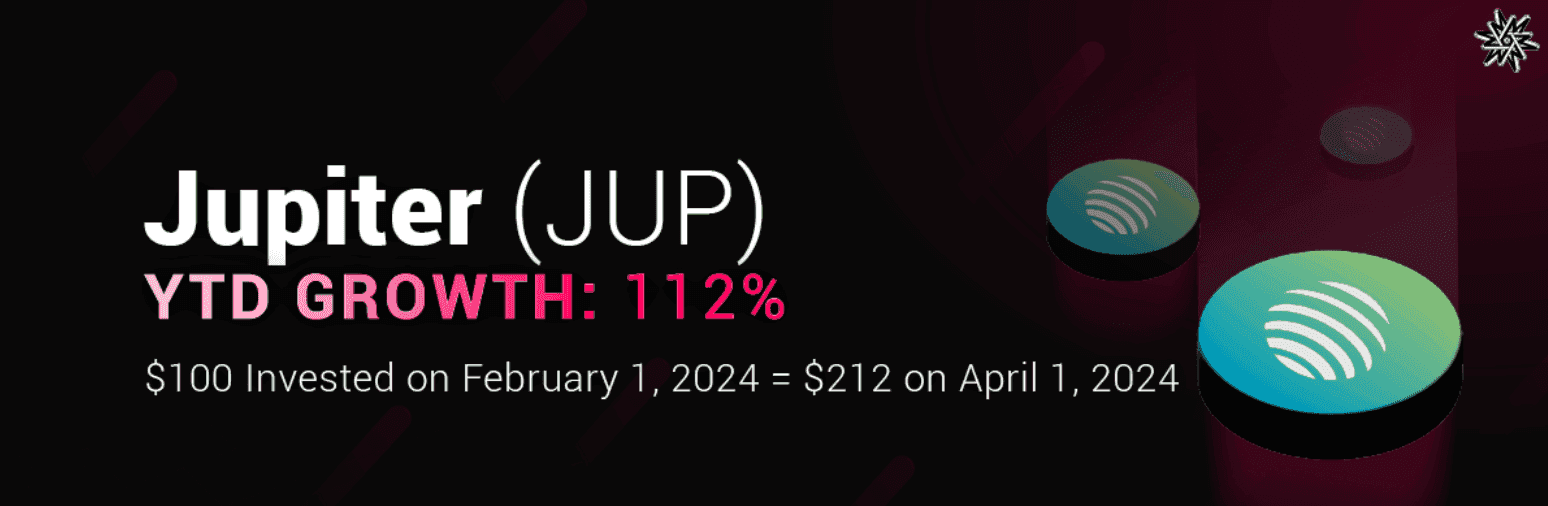
Jupiter (JUP)
- TVL: $386.48m
- Fully Diluted Valuation: $16.77b
Jupiter’s JUP token had one of the largest airdrops ever on January 31, when $700 million worth of JUP tokens were distributed to nearly a million wallets. Since then, there has been plenty of hype surrounding the token, as evidenced by its price action.
JUP Technical analysis
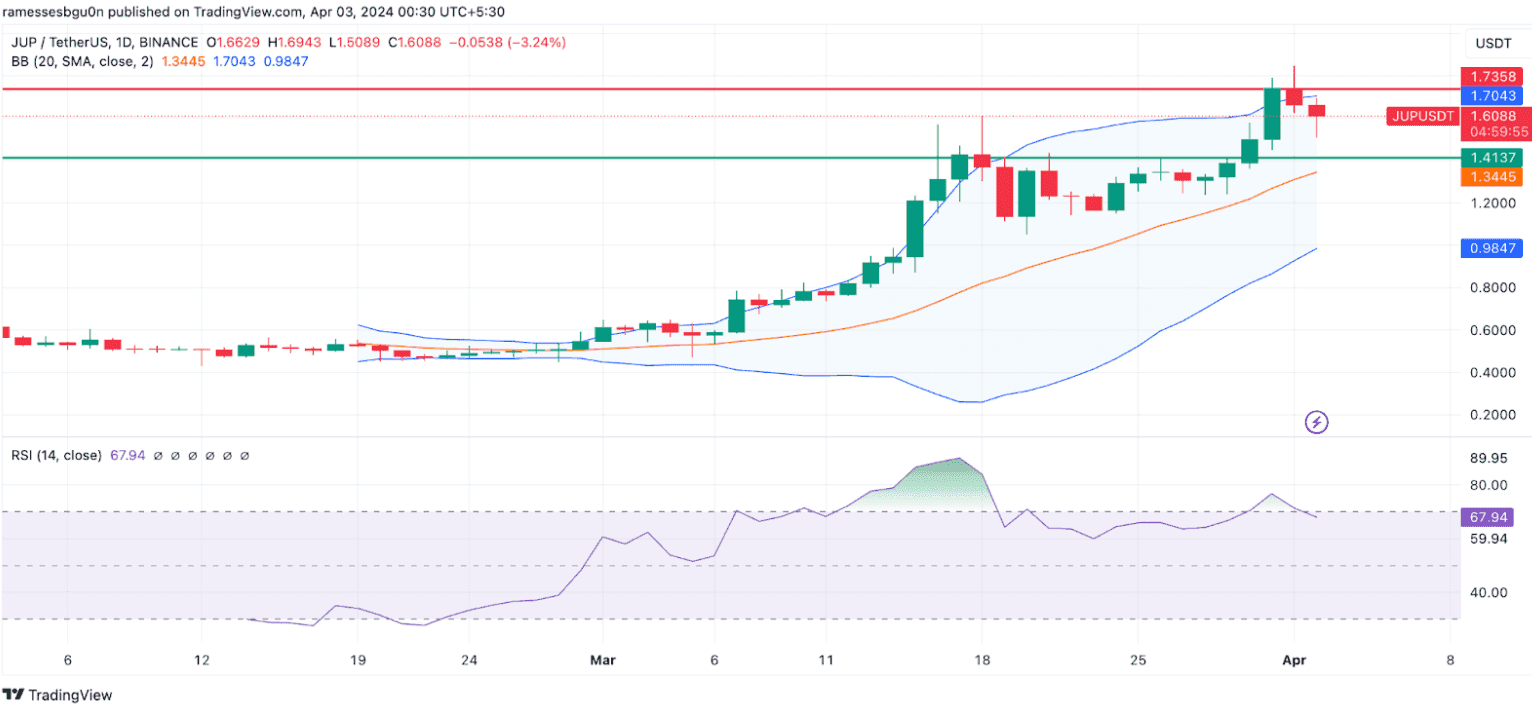
JUP hit a wall at $1.734, hinting it was too pricey. Two signs confirmed this: First, it broke above the Bollinger Band's top limit, a classic overbuy signal. Second, its RSI also screamed "overbought."
After a bit of a pullback, things look more balanced. The price is back in a normal range. Now, if the bulls ramp up, expect a push toward that $1.73 mark once more.
Factors determining growth
Jupiter is a Solana-based decentralized trading aggregator that has quickly become one of the most popular DeFi apps in Solana. With liquidity flooding in, demand for the token grew.
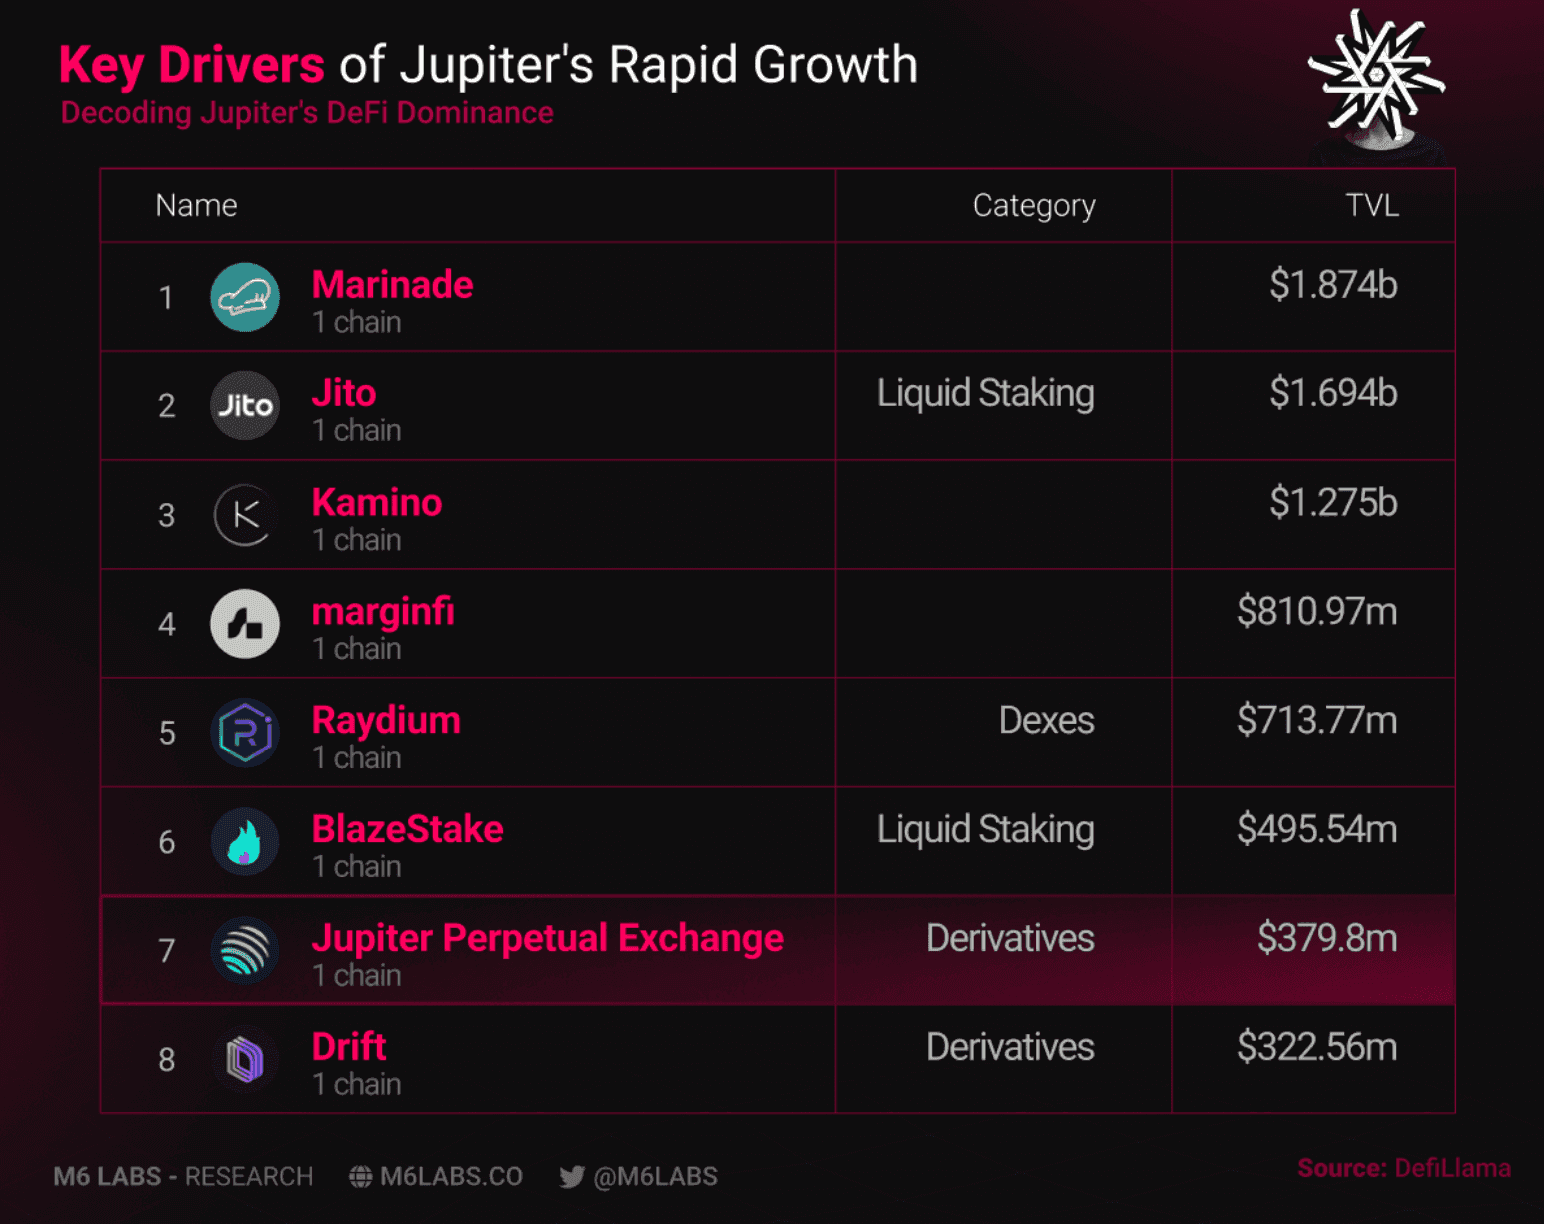
One of the major catalysts propelling Jupiter's price surge is the relentless dedication of its team to evolve and enrich the Jupiter ecosystem. A standout move has been the rollout of the LFG Launchpad, a game-changer that has significantly contributed to the successful debut of popular memecoins like WEN.
The LFG Launchpad stands out due to its groundbreaking dynamic liquidity management mechanism (DLMM). For a technical deep dive on how DLMM works, read this.
Solana (SOL)
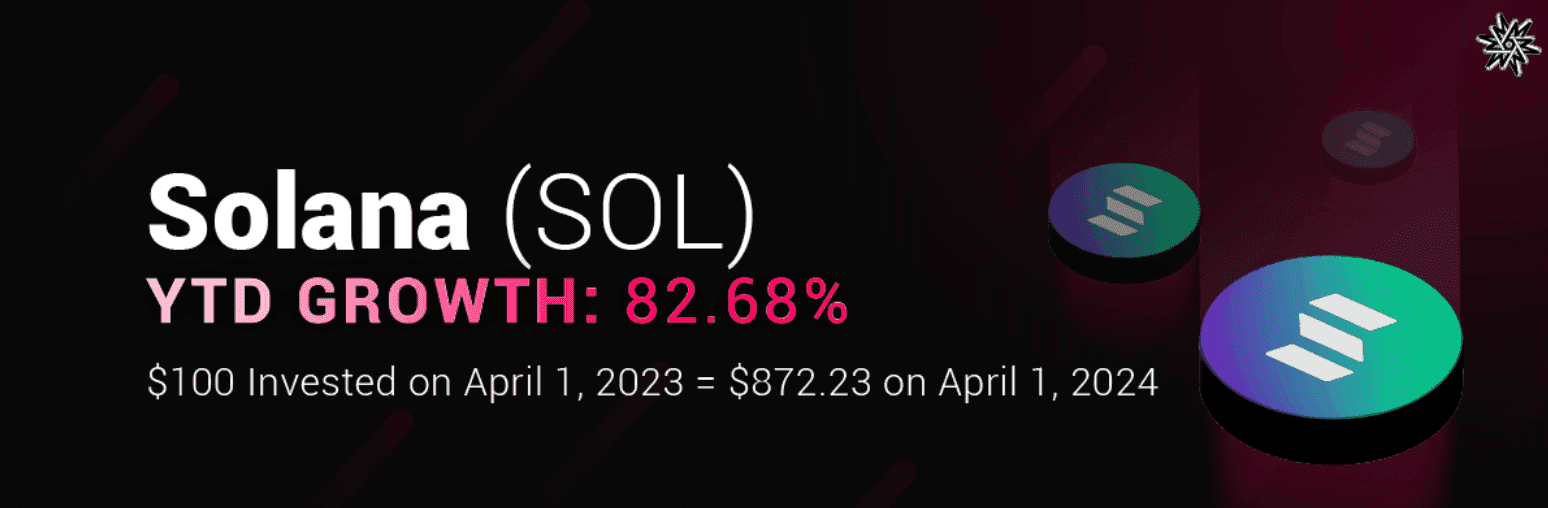
- TVL: $4.787b
- Bridged TVL: $24.138b
- Fully Diluted Valuation: $108.985b
Following its post-FTX dip, the Solana ecosystem has shown tremendous growth and activity. On March 17, 2024, SOL crossed $200 for the first time since December 27, 2021. Even though the price has since corrected to $186.44, there is still plenty of upward potential.
SOL Technical analysis
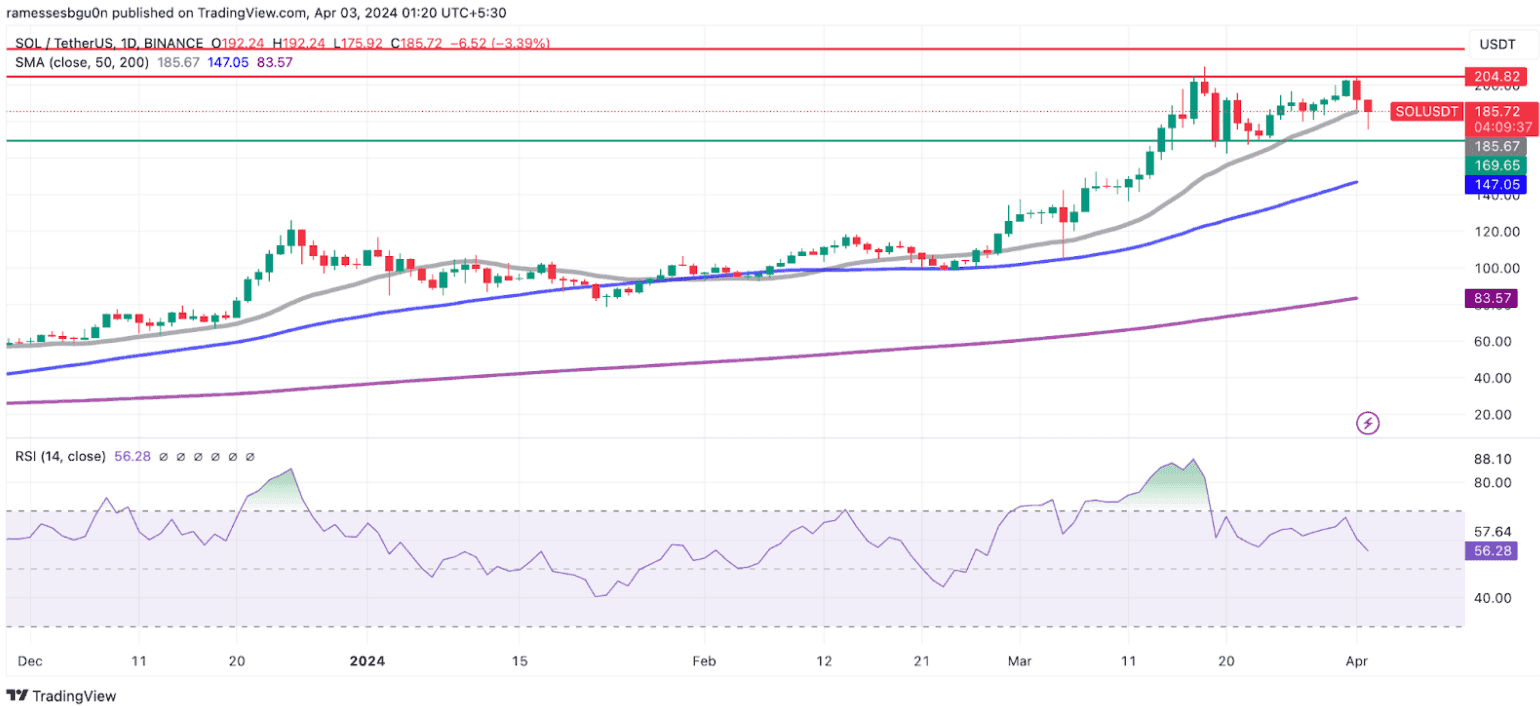
SOL's upward momentum hit a snag at the $205 resistance, causing a retreat to $186. This pullback saw SOL dip beneath the 20-day SMA support.
Without a swift bullish comeback, SOL could be eyeing a further slide to the $170 support zone.
The $205 level remains a formidable ceiling, historically tough for bulls to crack, as evident in the wider chart view.
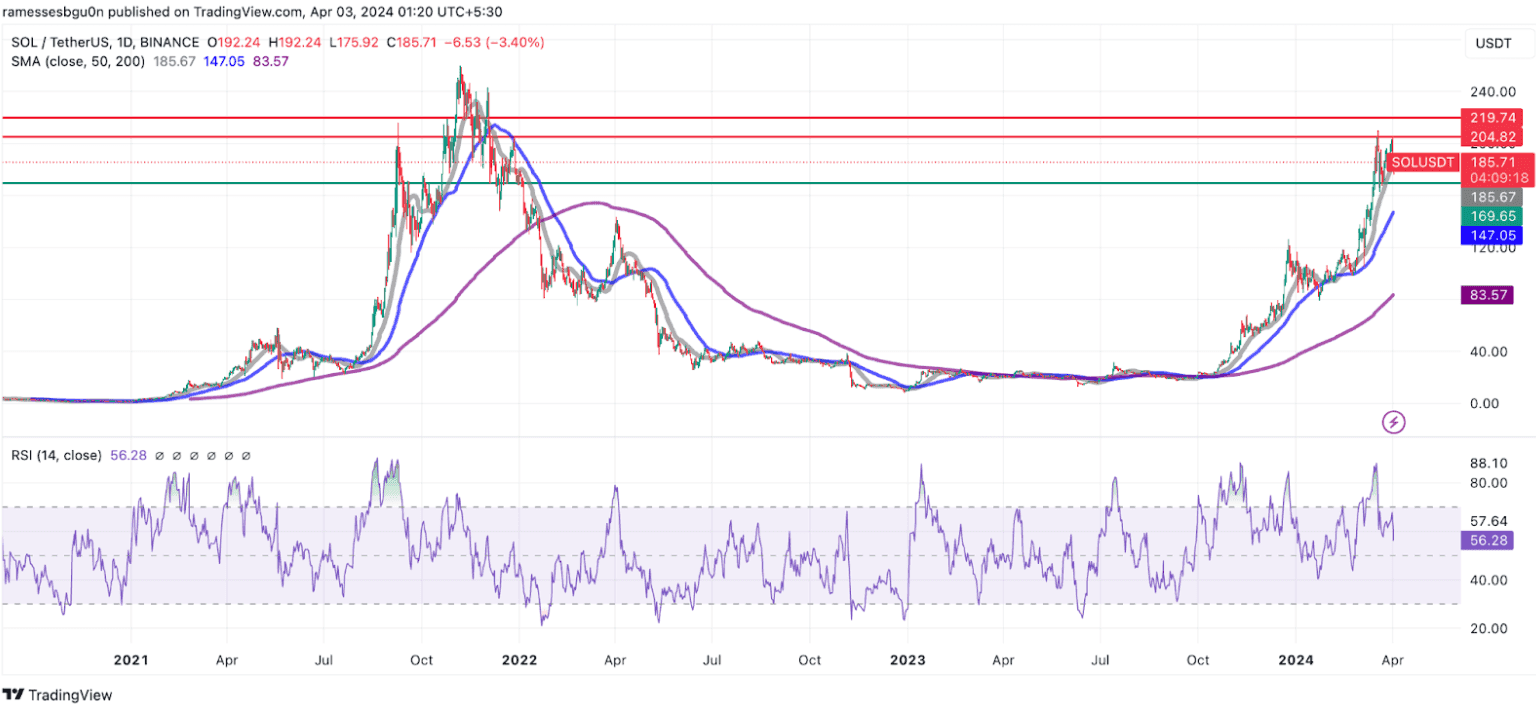
If the bulls do break through this resistance, SOL could potentially reach $220.
Factors determining growth
The Solana ecosystem has grown a lot, thanks in part to memecoins, which are fun digital currencies based on memes. These coins are popular on social media and have a big following. Solana's ability to handle lots of transactions quickly and at a low cost makes it a good place for hosting these memecoins.
Some popular memecoins on Solana are - Bonk (BONK), Dogwifhat (WIF), and Book of Meme (BOME). Solana memecoins currently account for an $8.2 billion marketcap!
To put it in perspective, Solana's memecoins outvalue Litecoin, the world's 22nd largest cryptocurrency.
How about you start doing some chart reading and analysis of your own? Let’s introduce you to some handy tools.
Learning To Fish
So first thing is first with so many options out there, where does one turn?! There’s a deluge of tools and sites all beckoning you to pay that subscription fee, promising you the most user-friendly experience.
Don’t get us wrong, many of these products are great, but what are the core products one needs when venturing into the world of crypto? Well again, we’ve got you covered anon!
CoinMarketCap
CoinMarketCap provides a one-stop platform for crypto enthusiasts to delve into the world of digital assets. On its homepage, users can easily explore rankings of various cryptos along with essential data like market capitalization and current prices.
Users can delve deeper into individual coins to uncover key insights and explore available trading pairs, and discover emerging trends across categories such as derivatives, DeFi, and yield farming, offering valuable opportunities for investors. With user-friendly filters, narrowing down your search to find the perfect crypto gems becomes effortless.
Moreover, check out exchange rankings to identify the best platforms for your trading needs. Finally, personalize your experience by creating a watchlist to effortlessly track your favorite cryptocurrencies over time.
But wait, there's more! Beyond price rankings, CMC also provides the latest news and project updates through the Headlines section, while expanding your crypto knowledge with the comprehensive encyclopedia available in the Academy.
Earn rewards for learning about new crypto assets through the Earn feature, and discover ongoing promotions and giveaways on various platforms with the Events section. Best of all, CoinMarketCap is completely free to use, making it accessible to seasoned traders and crypto newbies alike.
Visit CMC here.
Coingecko

Similar to CoinMarketCap, CoinGecko is another popular site offering a wide range of services for traders of all levels. As an independent data aggregator, it tracks over 9,000 cryptos across hundreds of exchanges worldwide, providing valuable insights to inform your trading decisions.
With CoinGecko, you can explore market trends, compare exchanges, discover new NFTs, and monitor your portfolio with ease. The platform's user-friendly interface and customizable filters make navigating the crypto world simple and intuitive.
One of CoinGecko's standout features is its comprehensive market analysis, offering real-time data on trading volumes, market capitalization, and social network activities for each crypto asset. Whether you're a scalper, day trader, or long-term investor, CoinGecko will provide value.
CoinGecko offers various account levels to suit traders of all levels, from a free account with essential data services to premium and premium plus accounts with added perks like ad-free content, exclusive NFTs, and direct access to research analysts.
Overall, CoinGecko is a trusted name in the industry, known for its unbiased, live market data and reliable insights.
Visit CoinGecko here.
TradingView
TradingView is probably the most popular platform for traders, it delivers high-quality information for crypto, stocks, bonds and much more. You name it and TradingView has you covered!
But unfortunately there’s a fee to access this Aladdin's Cave of financial information.

Now TradingView has multiple registration categories depending on your experience and financial situation. Users who are keen to get involved with TradingView can try out the platform with a free account, but unfortunately, most of the cool goodies will all be restricted. We highly recommend getting the basic Essential Plan and sussing out the platform, even if it's just for a short time.
Visit TradingView here.
Dex Screener
Moving on, so where do most of the degens hangout in crypto? Well, Dex Screener, of course!
Dex Screener is the ultimate theme park for degens. Many spend countless precious hours of their lives watching the new launches page, checking metrics such as liquidity, token pairs and price action in the hopes of entering the next 40 gazillion X, and many actually do!
Though be warned reading charts can assist in timing your entry and exit positions, but when shitcoining on Dex Screener you’re entering the realm of crypto Las Vegas.
Some killer features of Dex Screener include:
- Tracks data from approximately 100 DEXs across 80+ blockchain networks, keeping you in the loop with all the crypto action!
- Accessible for free without registration via web browsers and mobile apps, because who needs more passwords to remember, right?
- Supports technical analysis with TradingView charts and various technical indicators, giving you the power to decode the crypto mysteries!
- Supports thousands of token pairs, over 70 blockchain networks, and dozens of DEXs, making it the ultimate playground for crypto enthusiasts!
These are just some of the features offered by Dex Screener, and best of all its totally free!
Visit DexScreener here.
Before we sign off, make sure to check out our guide on profit-taking strategies. In the article, we delve into essential strategies that can help you navigate the crypto markets more effectively. These methods are designed not only to protect your investments but also to optimize your profit potential.
That's it for this week Anon! See you next week!
Enjoyed this article?
- Subscribe to Crypto Pragmatist by M6 Labs newsletter for crypto-native industry insights and research read by 30k+ subscribers
- Follow us on Twitter for Tweets providing top-notch insights and bridging the gap between users, builders, and leaders in the crypto space

Disclaimer: These are the writer’s opinions and should not be considered investment advice. Readers should do their own research.