In the last few months, Bitcoin and all other cryptocurrencies have been more or less trading sideways with a few bigger drops and pops. Many who have tried to enter the market when there were signs of a possible uptrend have ended up losing their money when the market has suddenly reversed.
The same has happened to those who have tried to avoid a bear market by selling in the few sharp drops we’ve had. If you are one of these two people and keep wondering why every time you think something is going to happen, the opposite thing happens, and that it is like someone wants you to lose money, then you need to read this article because someone is doing precisely that.
In the last few weeks or earlier, you might have read or heard about a term called the Wyckoff method. This term may not mean anything to you, and you maybe haven’t looked into it any further, but it is time for you to know what it is and how it affects your crypto investments.
What is the Wyckoff Method About?
To understand the Wyckoff method, you need to know the basics of technical analysis, or at least know what it is. You can watch the Coin Bureau video about technical analysis from this link; it would help you tremendously ito understand this topic. For those who didn’t watch the video, let me just briefly tell you what technical analysis is.
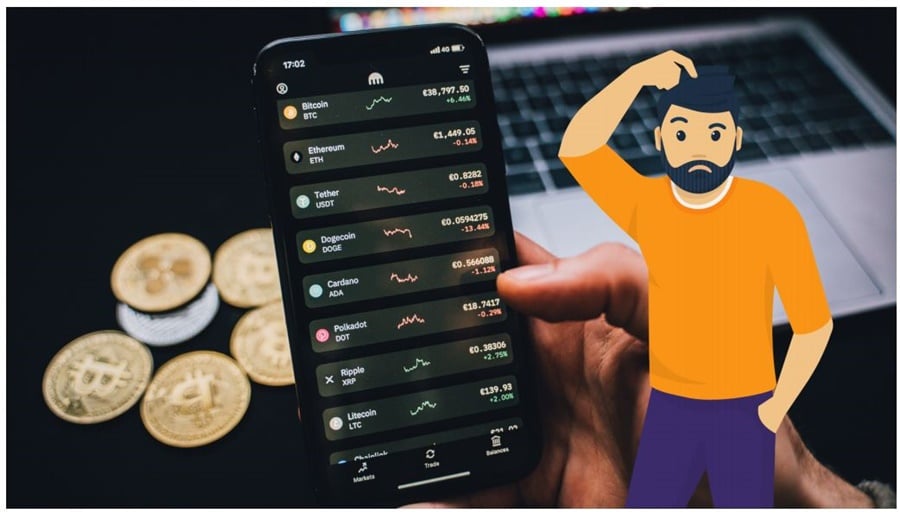 Are you confused by crypto technical analysis? Get knowledge here! Image via Pexels.com
 In short, technical analysis is when traders analyze charts to try to distinguish different patterns that should predict where the price is headed and then trade stocks or cryptos according to those. TA might sound stupid for some people since it does not take into account any fundamentals of an asset you are analyzing.
But when thinking about what it is truly based on, you find that it's just looking at how people react in certain situations. When studied long enough, you start seeing patterns that happen regularly due to human psychology and how we respond to emotions like fear and greed.
Because many people use the same basic technical analysis by forming support and resistance lines to see from where the price usually jumps back up and from where it starts going down, it is easy for big institutions to manipulate the market by going against these typical patterns.
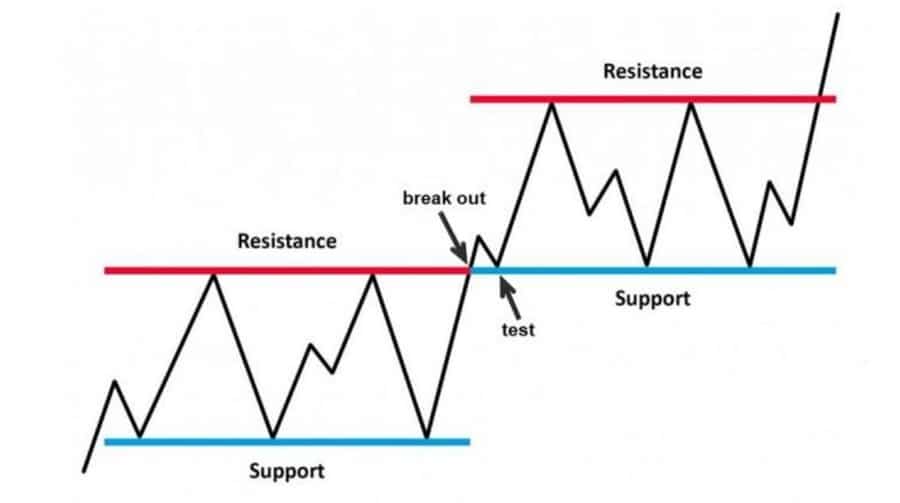 Technical analysis tries to find these areas of support and resistance. Image via IQTraderPro.com
 For example, usually, when the price breaks up from the resistance line, it tends to continue to go up for some time, but if big institutions go against that and push the price down, then fear will take over for those who were certain that the price was going up and they will sell as panic and uncertainty take control of their actions. That, in turn, makes the price go even further down, which opens up a perfect time for institutions to buy low.
This is basically what the Wyckoff method is all about, institutions going against typical trading patterns to benefit from other people's FUD.
History of the Wyckoff Method
In the 1930s, Richard Wyckoff noticed that these institutional investors were playing against retail investors in the stock market and that they made a lot of money while retail investors couldn’t understand the market movements, which made them buy and sell at completely wrong prices. In hopes of educating people about how the institutions are tricking them, he exposed the method they use, which is now named the Wyckoff Method.
Wyckoff wanted retail investors to learn how the markets move so that they too could benefit from it. For people to better understand the markets, he suggested that the price movements in the stock market should be thought of as the actions of one man, which he named “composite man”.
“…all the fluctuations in the market and in all the various stocks should be studied as if they were the result of one man’s operations. Let us call him the Composite Man, who, in theory, sits behind the scenes and manipulates the stocks to your disadvantage if you do not understand the game as he plays it; and to your great profit if you do understand it.” (The Richard D. Wyckoff Course in Stock Market Science and Technique, section 9, p. 1-2)
How do you spot the Wyckoff method?
There are only two different kinds of patterns representing the Wyckoff method, and both are fairly easy to spot. What makes it harder to benefit from these patterns is the structure. Both patterns are divided into phases, and it might be hard to distinguish the different phases, as patterns can be many months long or just a few hours long. One of the patterns is called accumulation, and that is when institutions will push the price down to buy at a discounted price, and the other one is distribution, where they are looking to sell high.
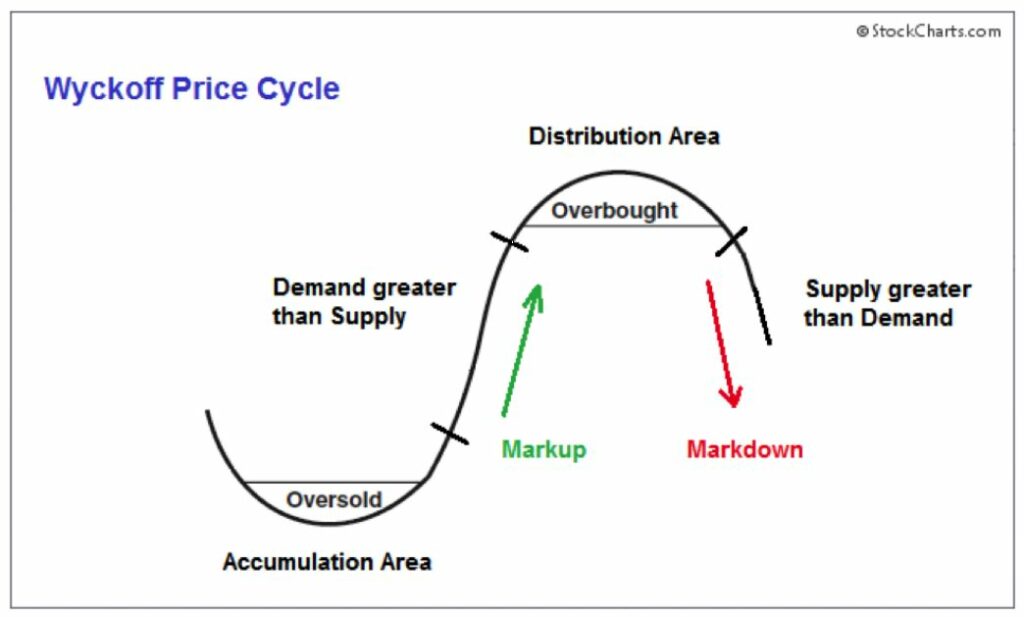 Wyckoff accumulation and distribution. Image via Stockcharts.com
 If you want to learn more in-depth about the Wyckoff Method, I strongly suggest watching the coin bureau video about it from this link. However, if you don’t have the time to watch it now, then you can look at these pictures below and visit stockchart.com for more information.
What you can see from these pictures is the basic shape that accumulation and distribution take. You can also see that both are divided into different phases.
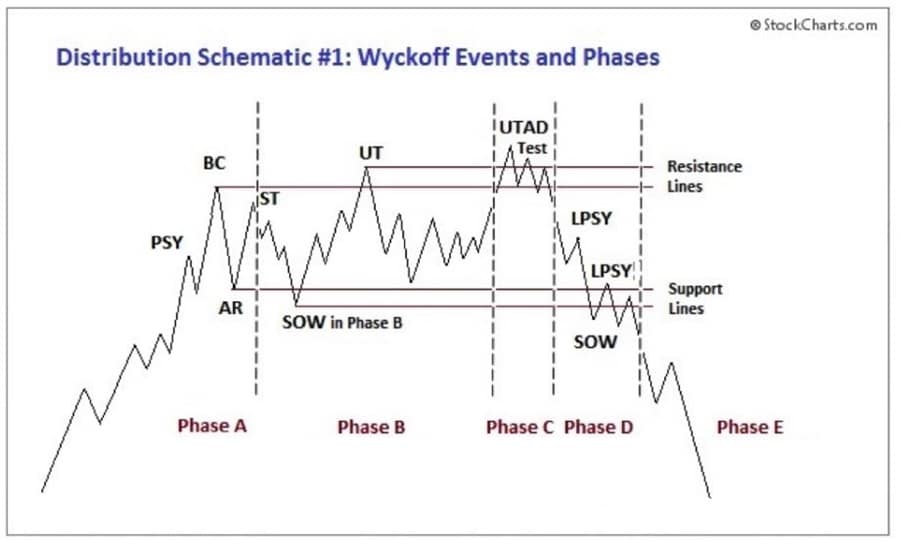 Price action follows a series of phases. Image via Stockcharts.com
 This is because institutions with their large holdings can’t simply buy however much they want, or whenever they want, without influencing the market, which is why they have to form these sideways movements where they buy/sell consistently.
This is why, as already mentioned, the sideways movement can vary in time and size depending on how much institutions buy or sell. There can also be other factors like some unexpected black swan which disrupts the pattern and can make it harder for both institutions and retail traders to get a hold of the market. Generally speaking, though, you can find all of the most important phases if it really is institutions or large investors using the Wyckoff method.
How does it apply to the Crypto Market?
As you might have noticed, Wyckoff has not been alive at the same time as cryptocurrencies, so you might be wondering if it even applies to cryptos. The simple answer is yes, yes it does, and in my opinion, it is even easier to use in cryptos than in stocks. So hear me out.
In general, cryptos are much more volatile than stocks. Due to a lack of knowledge in the crypto space, it is much more difficult to estimate a cryptocurrency’s intrinsic value than it is for a traditional company. This is why I believe that institutions have a lot easier to cause fear or greed in the market. If the Bitcoin price suddenly drops 20% due to manipulation, it will most certainly cause panic among newbie retail investors who thought they would get rich quick with cryptos. This further pushes the price down and can create an even greater drop than 20%, which gives institutions a more than perfect time to buy in.
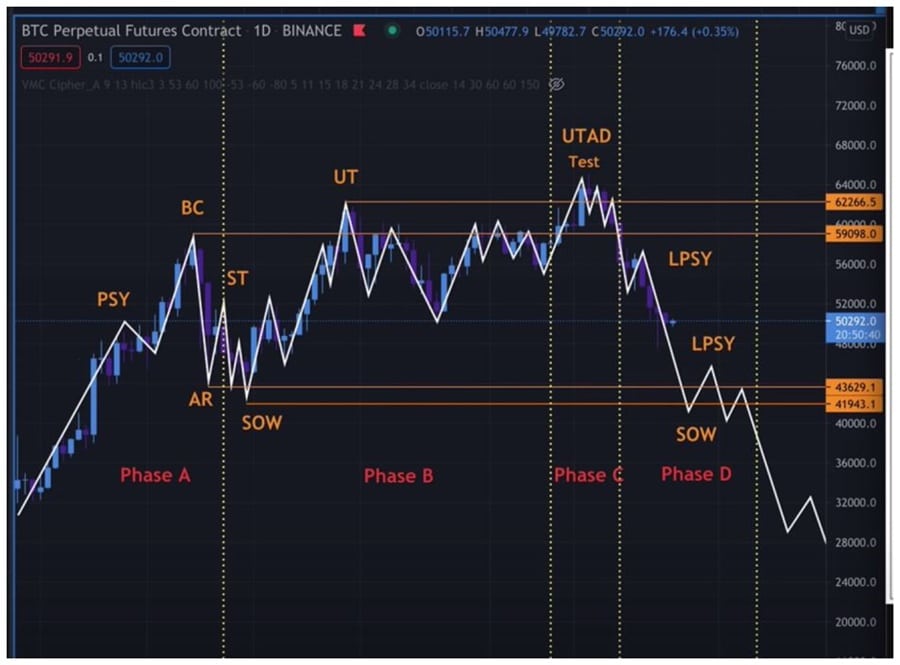 Wyckoff distribution in Bitcoin. Image via Youtube
 The same applies when institutions want to sell, and actually, this year's spike to $64,000 was a perfect case example of the Wyckoff method being used by large investors.
While big names in the business industry were giving crazy price targets from $100,000 to $500,000, Bitcoin continued surging past $50,000 and $60,000. This caused many retail investors to get hit by FOMO (fear of missing out) and greed. This, in turn, caused them to buy in no matter how high the price was. At the same time, though, large investors were dumping their holdings and taking home huge profits, which led to a large supply of coins and eventually, there was more supply than demand which made the markets crash.
Where are we Now?
Hopefully, you were interested enough to watch the videos that I referred to earlier because if you did, you should now truly know what the Wyckoff method is all about, but if not, you can always go back and watch them from the links I left. But even if you watched both videos, there might still be one question you would like to know the answer to - where are we now?
Well, right now, many of the traditional patterns of TA are being broken, which might mean that someone is manipulating the market. Another fact that further supports the argument that the market is being manipulated is the statistics from Chainanalysis, which tells us that 86% of daily trading volume comes from large investors.
Just look at this chart and compare it to the chart of how a typical accumulation phase looks, then tell me they do not look similar.
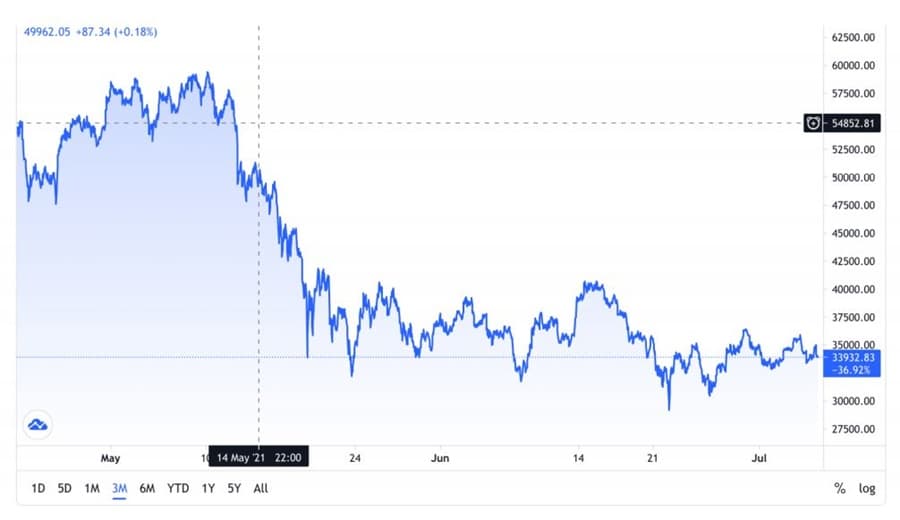 Past three months price action in Bitcoin. Image via TradingView.com
 As I thought, you can’t do that. The question then is, where are we now. As a newbie to these myself, I could try to argue that we are already past phase C and the string, but when further researching it, I now strongly believe that the string is still ahead of us, and why is that?
Well, right now, there is a lot of uncertainty in crypto, especially in bitcoin due to regulations with China and then a large Grayscale bitcoin fund getting ready to unlock shares which might cause some selling pressure. This uncertainty makes, for example, JP Morgan analysts think that bitcoin’s price will likely hit a low of $25,000 before bouncing back up, and that could then be the spring phase.
This, of course, isn’t something you can be completely sure about, and before even thinking about making any moves in your crypto portfolio, I strongly suggest you read the rest of this article.
How to use your Knowledge
The question that still stands is how you should use this information to guide yourself to bigger gains in the crypto market. The answer actually isn’t that hard to find and might come out as kind of simple. The answer is - don’t use it - and I’ll tell you why.
 What will you do with your new-found crypto knowledge?
 First of all, because technical analysis isn’t the only factor that plays a role in the market. You might get completely burnt when some unexpected event happens, like a huge wave of regulations worldwide starting tomorrow. I’m not saying this will happen, but it is something that you couldn’t forecast by looking at charts.
Second of all, because of the high volatility in crypto, trading can be extremely costly when prices can dip more than 10% in a matter of minutes. Lastly - as in all trading - the amount of money you would have to use to cover the trading fees and potential taxes is quite a lot. You would be left with just a small fraction of the amount you made from your trade.
The best thing to do if you are a believer in cryptocurrencies for the long run is to become a fellow HODLer and try to stay calm when others are struck by fear or greed.
 It's best to simply Hodl.
 These patterns, like the Wyckoff Method, may be moving the price of cryptos in the short term, but if the product (in this case cryptos) is good, then the price will also reflect that when you look at it again in 10 years.
What if I want to use my Knowledge?
You might be completely bored with my answer in the last section, especially after reading this whole article and watching the two videos I referred to, so let’s play a game of how you could use all this information IF it were something that would be smart to do?
Well, because we can try to see the different phases both in an accumulation and distribution, you could try to time your buying and selling in these to get the best price. Before you buy, it might be smart to check the chart and try to spot where the price could possibly bottom and then start buying when we get closer to that point. It could also be smart to buy in small positions in case that your analysis was wrong and the prices keep dropping from the level you thought we might bounce back up.
The same applies to when you are trying to sell your coins. You can try to spot where we might be and start selling when we start approaching the place you believe is the top. One thing you do have to remember is that, as already mentioned, the different phases can vary in both time and size, and you can potentially lose a lot of money if entering at the wrong time.
 If timing the market were easy, we'd all be rich.
 The problem with trying to play the market like the institutions do is that when more and more people start using the Wyckoff charts as bases for trading or trying to buy low or sell high, then that will become the next normal and institutions will see that and they will start playing against you with a different approach. If everyone is now waiting for the spring to happen - so that we could buy the dip - institutions might keep pushing the price further down until fear starts taking over and the sell-off they were hoping for becomes even greater.
Conclusion
That is why I’ll stick to my opinion that the best thing to do is to consistently buy the dips and then HODL. The value of Bitcoin, or any other crypto for that matter, will move upwards in the long run if it keeps getting adopted and we see more positive news for cryptos.
Therefore trying to play the market in the short term will most certainly only lose you money compared to what you could have made with just buying consistently and HODLing. If you do not believe me in this, then just take a look at the numerous researches made about the stock market where almost always those who trade actively lose to the ones that are in it for the long run.
Occasionally, of course, when you are in the market and especially the crypto market you will experience large drops where you cry at night for not selling and then buying back later. But it is impossible to know when the market will turn; the prices could just as well go up another 100%, and if you would have sold, you would most certainly be even more depressed than if it was the other way around. That is why you’ll just have to remember your initial bull case and try to stay calm when navigating your crypto vessel through the ocean of fear and greed.
Hopefully, you know now what the Wyckoff method is all about and how the institutions are trying to trick you into doing what benefits them the most. With this knowledge, you may not make any 100x gains but at least you can try to stay clear of buying or selling if you notice these patterns taking shape.
If you still want to learn more, I suggest you navigate your way to Youtube and search for the Wyckoff method. There is a lot of quality content about this phenomenon, and it’s always good to further educate yourself.